
Figure 4.
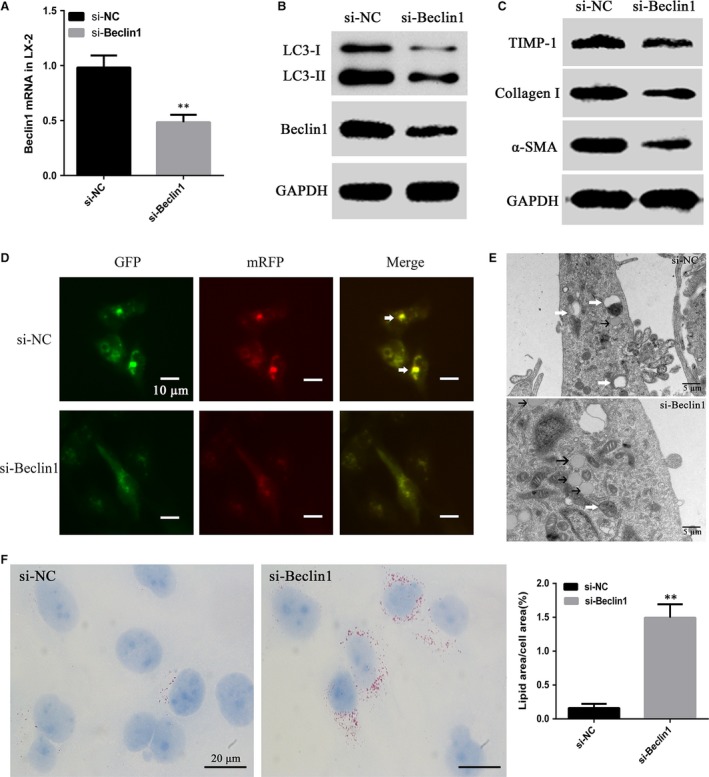
Knock‐down of Beclin1 suppresses the activation and autophagy of HSCs. (A) Beclin1 knock‐down efficiency in the LX‐2 cells was assessed by RT‐PCR and (B) Western blotting. (**P < 0.01) (B and C) si‐Beclin1 down‐regulates α‐SMA, TIMP‐1, Collagen I and LC3‐II/I in LX‐2 cells. (D) Autophagic flux in LX‐2 cells. Arrows indicate autophagosomes. (scale bar = 10 μm) (E) Electron micrographs in LX‐2 cells transfected with si‐Beclin1, white arrows indicate autophagic vacuoles, black arrows indicate lipid droplets. (scale bar = 5 μm) (F) Lipid content analysis in LX‐2 cells treated with si‐Beclin1 (scale bar = 20 μm) (**P < 0.01).