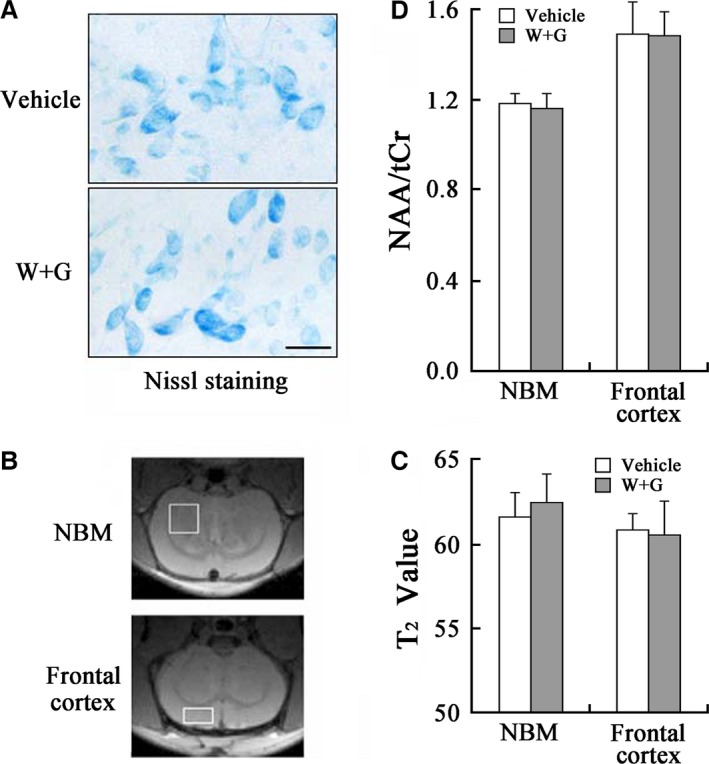
Figure 6.

Temporal alterations of the cell numbers and viability induced by WT and GFX in NBM and frontal cortex. (A) Nissl staining in NBM at 24 hrs after ventricular infusion. (B) The representative image of the rat brain demonstrated by MRI with placement and locations of voxel from NBM (3 mm × 3 mm × 1.5 mm) and frontal cortex (3.0 mm × 1.5 mm × 3.0 mm) respectively. (C and D) Quantitative analysis of T2 value and ratio of N‐acetyl‐aspartate to total creatine (NAA/tCr) in NBM and frontal cortex. The central of regional of interesting (ROI) in quantitative T2 map was same in all images, and the thickness was 0.8 mm. The spectra were shown with similar linewidth and with the amplitude adjusted using tCr peak at 3.03 ppm (Repetition time = 1.5 sec., Echo time = 136 ms, Number of averages = 512).
