
Figure 4.
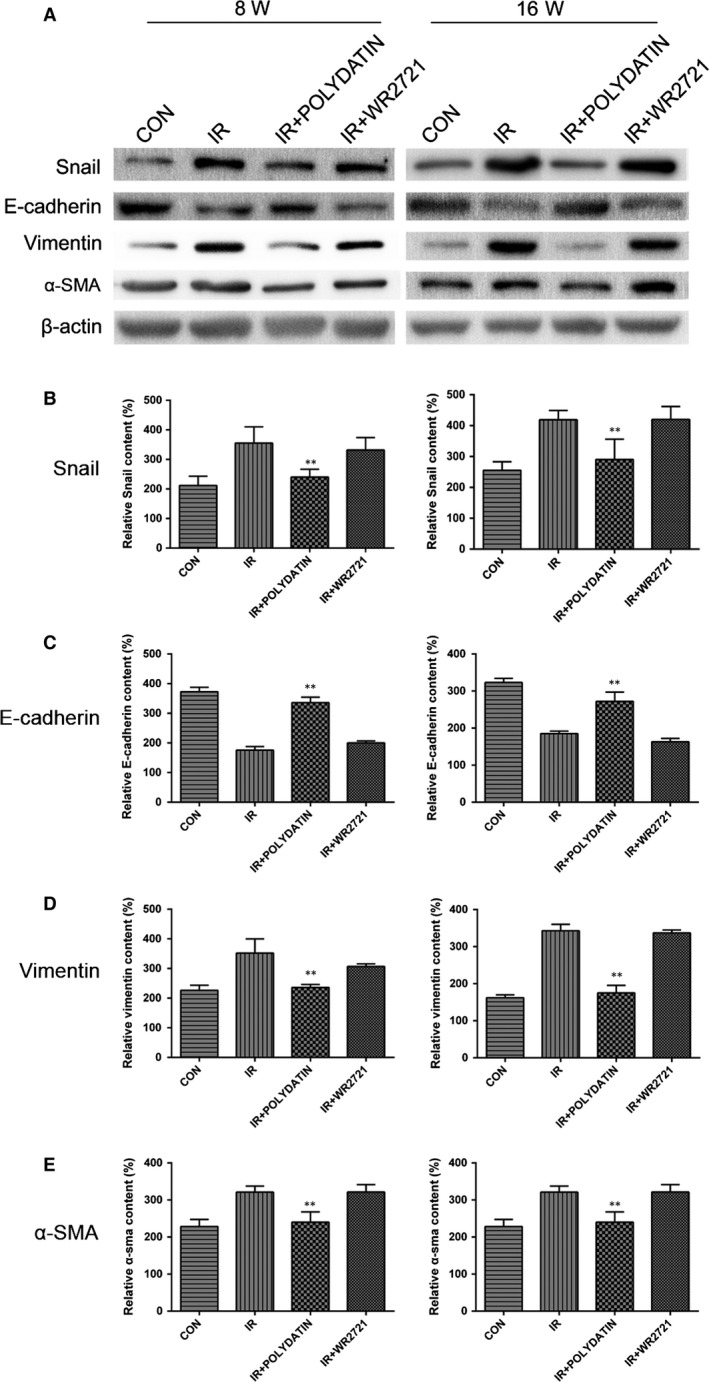
Polydatin reversed radiation‐induced EMT process evaluated by a Western blotting assay. (A) Western blot analysis of EMT markers in lung tissues from different groups. (B–E) Qualification of protein expression levels of E‐cadherin, Vimentin and α‐SMA in different groups. Values are given as mean ± SEM (n = 10), *P < 0.05 and **P < 0.01 versus single radiation group.