
Figure 5.
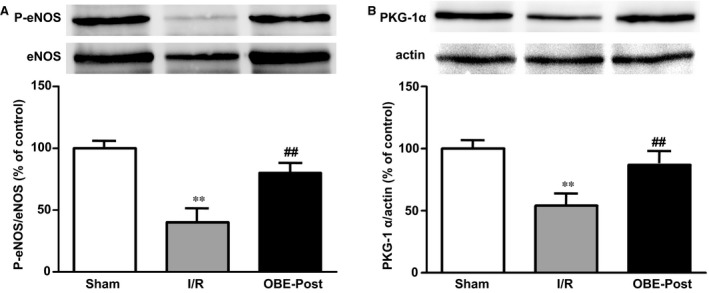
Effect of obestatin on phosphorylation of eNOS and on PKG‐1α expression. Western blot analysis was performed in lysates from LVs collected in Sham hearts after 90 minutes of buffer perfusion, and in either I/R hearts during reperfusion (after 20 min.) or in I/R reperfused with 75 nM obestatin (OBE‐Post) for 20 min. (A) eNOS phosphorylation and (B) PKG‐1α expression (upper panels). Blots, each representative of three independent experiments, were reprobed with total eNOS or actin antibody for normalization (lower panels). Graphs represent the densitometric analysis of P‐eNOS or PKG‐1α normalized to total eNOS or actin, respectively, and reported as per cent of Sham. **P < 0.01 I/R versus Sham; ## P < 0.01 OBE‐Post versus I/R.