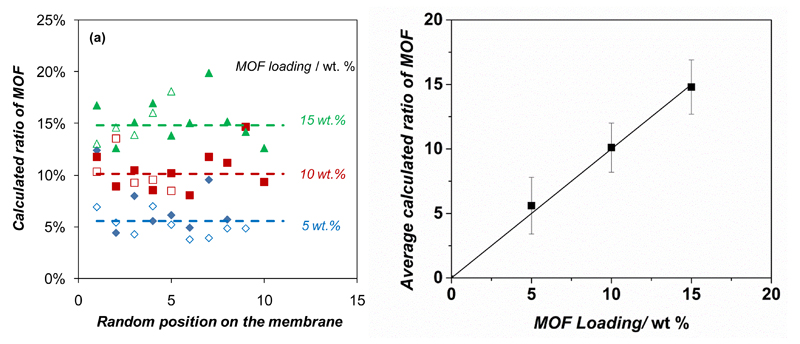
Figure 4.
Filler dispersion in the NH2-MIL-53(Al)@6FDA-DAM MMMs evaluated by Raman spectroscopy. a) Contribution of NH2-MIL-53(Al) in the modelled spectra at different locations on the membrane surface; b) comparison between the calculated spectroscopic ratio of NH2-MIL-53(Al) and the nominal content in the membrane. In Figure a), full and empty symbols represent measurements on each side of the membrane; dotted lines show the average value for all measurements on each MMM.

