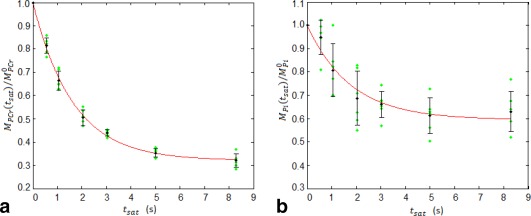
Figure 4.

Plots of the normalized magnetization ratio of (a) PCr and (b) Pi as a function of γ‐ATP MT saturation time (t sat = 0, 565, 1058, 2045, 3032, 5005, 8295 ms), and their least‐square regression curves (red solid line) for the averaged data (N = 6) according to Eqs. (1a) and (1b), respectively. Individual data, group mean, and standard deviation are represented by green dots, black circles, and error bars, respectively. The intrinsic and apparent longitudinal relaxation times of PCr and Pi ( = 5.1 ± 0.8 s, = 3.0 ± 1.4 s, = 1.7 ± 0.3 s, = 1.9 ± 0.7 s), and forward rate constants of the CK and ATPase reactions (k 1 = 0.37 ± 0.07 s−1, k 2 = 0.19 ± 0.07 s−1) at rest were determined from these regressions.
