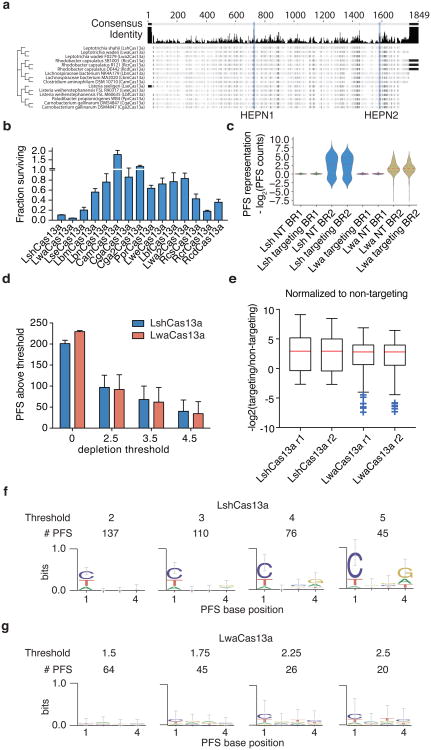
Extended Data Fig. 1. Evaluation of LwaCas13a PFS preferences and comparisons to LshCas13a.
a, Sequence comparison tree of the fifteen Cas13a orthologs evaluated in this study. b, Ratios of in vivo activity from Fig. 1B. c, Distributions of PFS enrichment for LshCas13a and LwaCas13a in targeting and non-targeting samples. d, Number of LshCas13a and LwaCas13a PFS sequences above depletion threshold for varying depletion thresholds. e, Distributions of PFS enrichment for LshCas13a and LwaCas13a in targeting samples, normalized to non-targeting samples. f, Sequence logos and counts for remaining PFS sequences after LshCas13a cleavage at varying enrichment cutoff thresholds. g, Sequence logos and counts for remaining PFS sequences after LwaCas13a cleavage at varying enrichment cutoff thresholds.

