
Extended Data Fig. 10. dCas13a-NF can image stress granule formation in living cells.
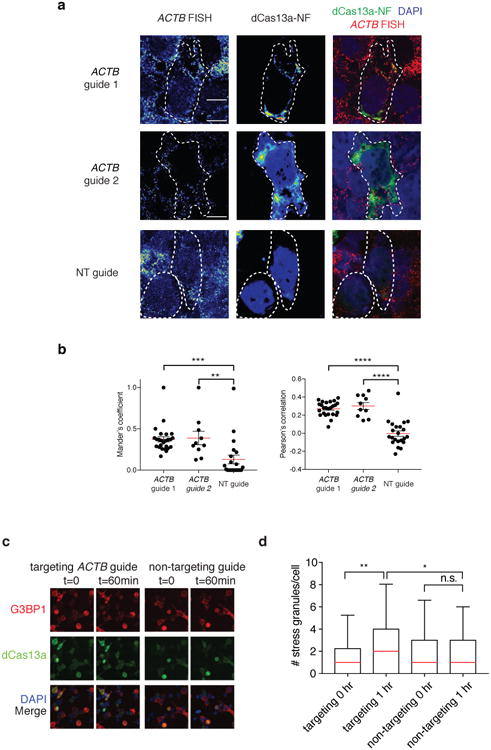
a, Representative images from RNA FISH of the ACTB transcript in dCas13a-NF-expressing cells with corresponding ACTB-targeting and non-targeting guides. Cell outline is shown with a dashed line. Scale bars, 10μm b, Overall signal overlap between ACTB RNA FISH signal and dCas13a-NF quantified by the Mander's overlap coefficient (left) and Pearson's correlation (right). Correlations and signal overlap are calculated pixel-by-pixel on a per cell basis. All values are mean ± SEM with n = 3. ****p< 0.0001; ***p< 0.001; **p < 0.01. A two-tailed student's T-test was used for comparisons. c, Representative images from live-cell analysis of stress granule formation in response to 400 uM sodium arsenite treatment. Scale bars, 20μm d, Quantitation of stress granule formation in response to sodium arsenite treatment. Quantitation is based on overlapping dCas13a-NF and G3BP1 puncta. All values are mean ± SEM with n = 3. ****p< 0.0001; ***p< 0.001; **p< 0.01; *p< 0.05. ns = not significant. A two-tailed student's T-test was used for comparisons.