
Figure 1. Cas13a from Leptotrichia wadei (LwaCas13a) is capable of eukaryotic transcript knockdown.
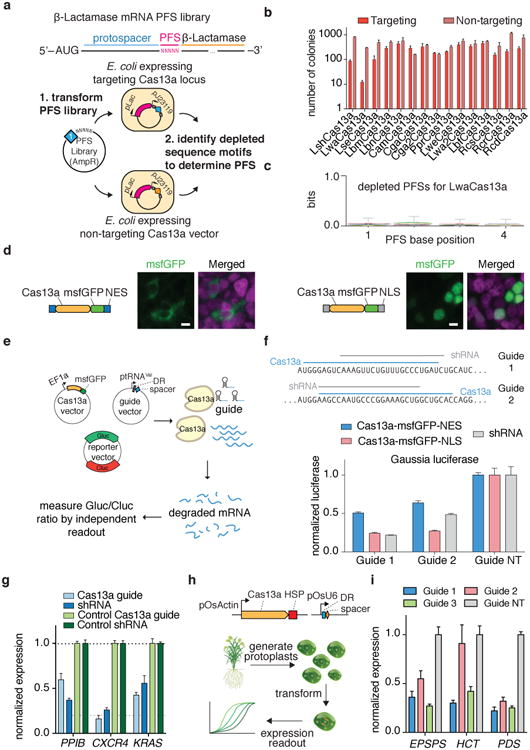
a, Schematic of PFS characterization screen on Cas13a orthologs. b, Quantitation of Cas13a activity in E. coli measured by colony survival from PFS screen. c, in vivo PFS screening shows LwaCas13a has a minimal PFS preference. Error bars indicate an approximate Bayesian 95% confidence interval. d, Imaging showing localization and expression of each of the mammalian constructs. Scale bars, 10μm. e, Schematic of the mammalian luciferase reporter system used to evaluate knockdown. f, Knockdown of Gaussia luciferase (Gluc) using engineered variants of LwaCas13a. Sequences for guides and shRNAs are shown above. g, Knockdown of three different endogenous transcripts with LwaCas13a compared against corresponding RNAi constructs. h, Schematic for LwaCas13a knockdown of transcripts in rice (Oryza sativa) protoplasts. i, LwaCas13a knockdown of three transcripts in O. sativa protoplasts using three targeting guides per transcript. All values are mean ± SEM with n = 3, unless otherwise noted.