
Figure 3. Evaluation of LwaCas13a knockdown specificity and comparisons to RNA interference.
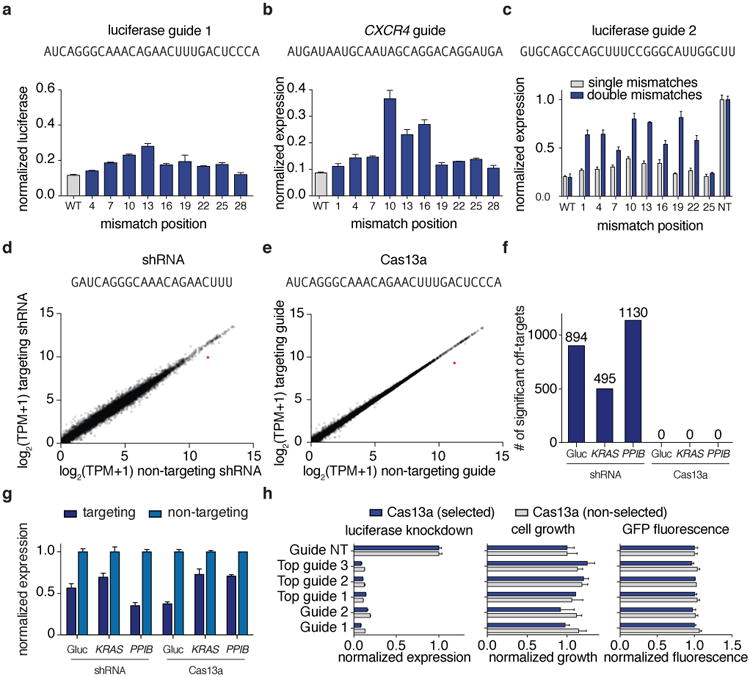
a, b Knockdown of Gluc (a) or CXCR4 (b) evaluated with guides containing single mismatches at varying positions across the spacer sequence (shown above). c, Knockdown of Gluc evaluated with guide 3 containing single or double mismatches at varying positions across the spacer sequence (shown above). d, e Expression levels in log2(transcripts per million (TPM)) values of all genes detected in RNA-seq libraries of non-targeting control (x-axis) compared to Gluc-targeting condition (y-axis) for shRNA (d) and LwaCas13a (e). Shown is the mean of three biological replicates. The Gluc transcript data point is colored in red. The guide sequence used is shown above. f, Differential gene expression analysis of six RNA-seq libraries (each with three biological replicates) comparing LwaCas13a knockdown to shRNA knockdown at three different genes. g, Quantified mean knockdown levels for the targeted genes from the RNA seq libraries. h, Luciferase knockdown (left), cell viability (middle), and LwaCas13a-GFP expression (right) for cells transfected with LwaCas13a for 72 hours with and without selection. All values are mean ± SEM with n = 3.