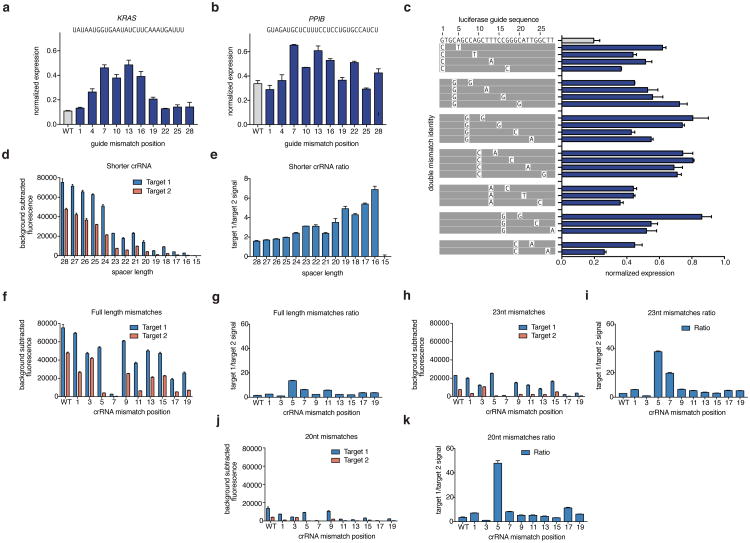
Extended Data Fig. 5. Detailed evaluation of LwaCas13a sensitivity to mismatches in the guide:target duplex at varying spacer lengths.
a, Knockdown of KRAS evaluated with guides containing single mismatches at varying positions across the spacer sequence. b, Knockdown of PPIB evaluated with guides containing single mismatches at varying positions across the spacer sequence. c, Knockdown of Gluc evaluated with guides containing non-consecutive double mismatches at varying positions across the spacer sequence. The wild-type sequence is shown at the top with mismatch identities shown below. d, Collateral cleavage activity on ssRNA 1 and 2 for varying spacer lengths. (n=4 technical replicates; bars represent mean ± s.e.m.) e, Specificity ratios of guide tested in (d). Specificity ratios are calculated as the ratio of the on-target RNA (ssRNA 1) collateral cleavage to the off-target RNA (ssRNA 2) collateral cleavage. (n=4 technical replicates; bars represent mean ± s.e.m.) f, Collateral cleavage activity on ssRNA 1 and 2 for 28 nt spacer crRNA with synthetic mismatches tiled along the spacer. (n=4 technical replicates; bars represent mean ± s.e.m.) g, Specificity ratios, as defined in (e), of crRNA tested in (f). (n=4 technical replicates; bars represent mean ± s.e.m.) h, Collateral cleavage activity on ssRNA 1 and 2 for 23 nt spacer crRNA with synthetic mismatches tiled along the spacer. (n=4 technical replicates; bars represent mean ± s.e.m.) i, Specificity ratios, as defined in (e), of crRNA tested in (h). (n=4 technical replicates; bars represent mean ± s.e.m.) j, Collateral cleavage activity on ssRNA 1 and 2 for 20 nt spacer crRNA with synthetic mismatches tiled along the spacer. (n=4 technical replicates; bars represent mean ± s.e.m.) k, Specificity ratios, as defined in (e), of crRNA tested in (j). (n=4 technical replicates; bars represent mean ± s.e.m.).

