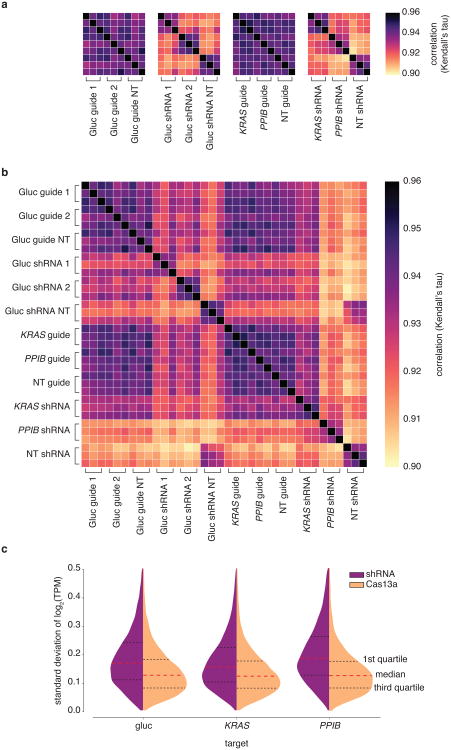
Extended Data Fig. 7. Detailed analysis of LwaCas13a and RNAi knockdown variability (standard deviation) across all samples.
a, Heatmap of correlations (Kendall's tau) for log2(transcripts per million (TPM+1)) values of all genes detected in RNA-seq libraries between targeting and non-targeting replicates for shRNA or guide targeting either luciferase reporters or endogenous genes. b, Heatmap of correlations (Kendall's tau) for log2(transcripts per million (TPM+1)) values of all genes detected in RNA-seq libraries between all replicates and perturbations. c,Distributions of standard deviations for log2(transcripts per million (TPM+1)) values of all genes detected in RNA-seq libraries among targeting and non-targeting replicates for each gene targeted for either shRNA or guide.

