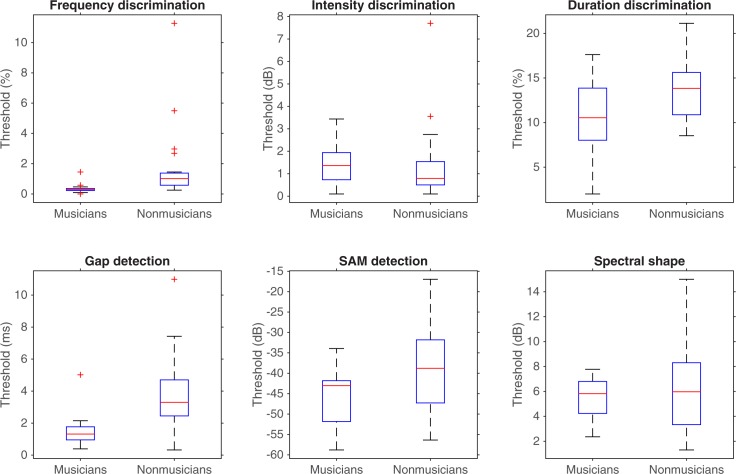
Fig 2. Boxplots representing the auditory performance of participants in the psychoacoustic tests.
In each box, the central mark is the median. The edges of the box are the 25th and 75th percentiles. The whiskers are the interquartile range (i.e., Q3-Q1) augmented by 50%, and the symbols are outliers.

