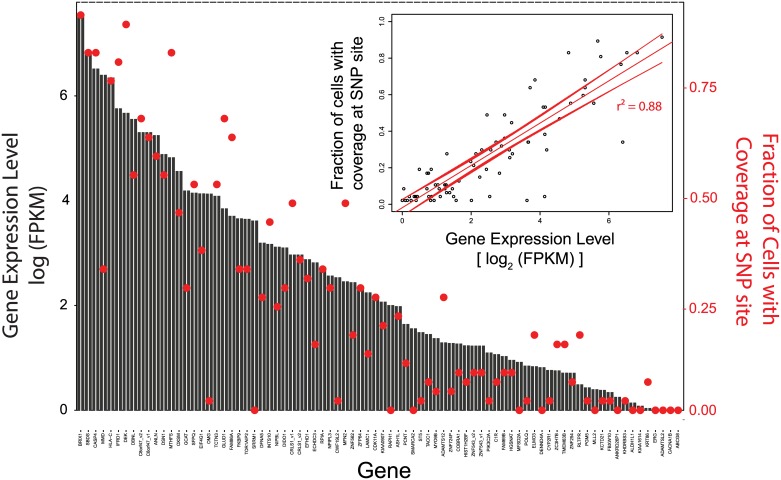
Fig 5. Relationship between SNP coverage and gene FPKM levels.
Gene expression levels (log2[FPKM]) are compared with the fraction of cells with coverage at every SNP site, and the inset shows the regression curve. A linear relationship is obtained, with an r2 of 0.88. A full list of the genes is provided in S2 Table, going from left to right.

