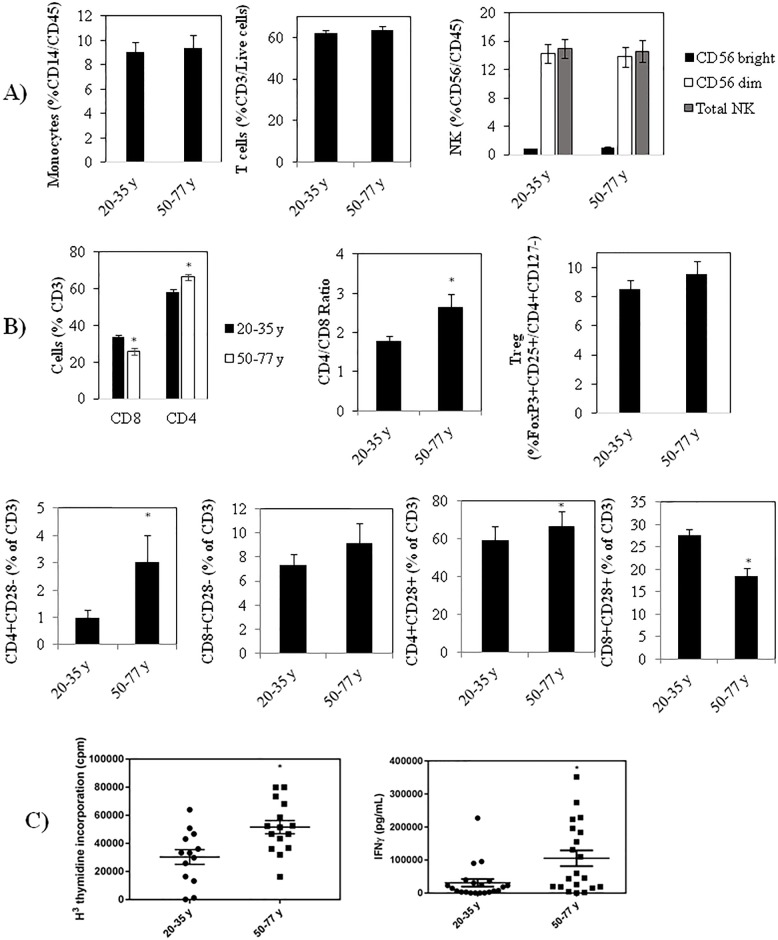
Fig 6.
(A) Differences in the proportions of monocytes, T cells and NK cells with age. (B) Differences with age in the % of T cells that are CD4+ and CD8+, in the CD4/CD8 ratio with age, in the proportion of T cells that are Tregs, and in the proportion of CD4 and CD8 cells that are CD28+ and -. (C) Anti-CD3 + anti-CD28 stimulated proliferation (left panel) and IFNγ production (right panel). Results are expressed as the mean ± SEM. * indicates a statistically significant difference (P <0.05) between the young and old cohorts.

