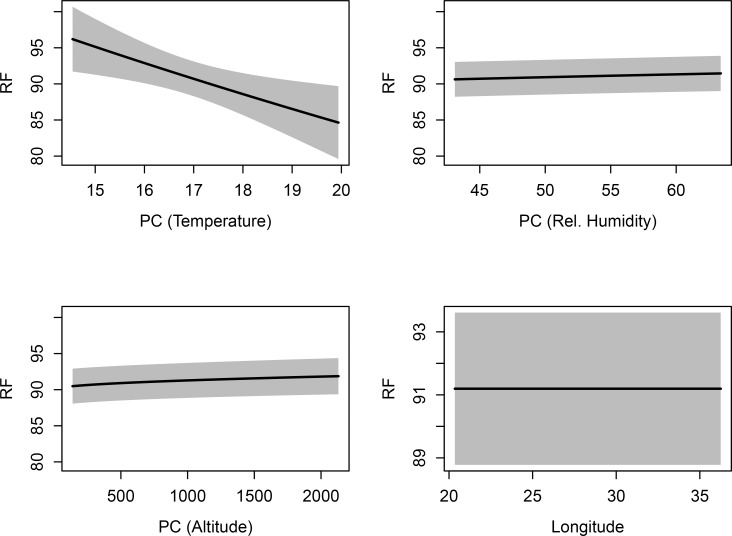
Fig 4. Predictive analysis plots showing how RF varies as each of AnnTemp (PC-Temperature), RH (PC-Rel. Humidity), Alt (PC-Altitude) and Longitude are varied whilst the remaining two climatic variables are kept at their mean values (calculated across study sites).
Explanatory details are given in the main text.

