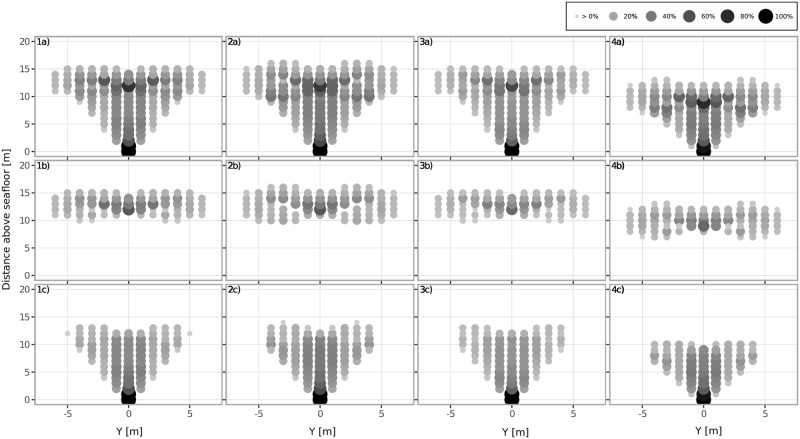
Fig 2. Probability (%) of a collision at each position in the cross-section between an animal and the a) entire structure, b) the kite, only and c) the tether, only for different configurations.
Columns represent the four different cases described in the main text; 1) baseline, 2) variation of kite trajectory, 3) longer kite period and 4) increased flight depth.

