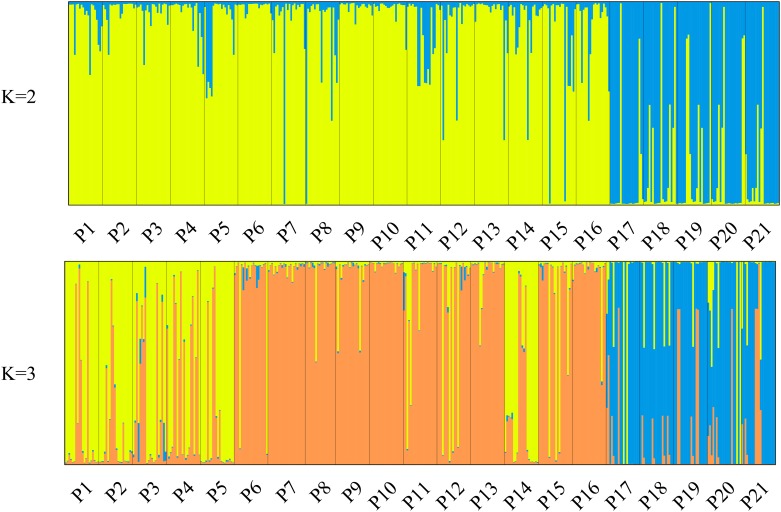
Fig 1. Clustering of 21 P. mira populations based on STRUCTURE analyses.
Population structure of 21 P. mira populations at K = 2 and K = 3. Each individual is shown as a vertical line divided into segments representing the estimated membership proportion; different genetic clusters were inferred using STRUCTURE. At K = 2, high-altitude populations (P17–21) were separated from the medium- and low altitude populations. Furthermore, medium-altitude (P6–13, P15, P16) and low-altitude (P1–5, P14) populations were assigned to two distinct clusters at K = 3.

