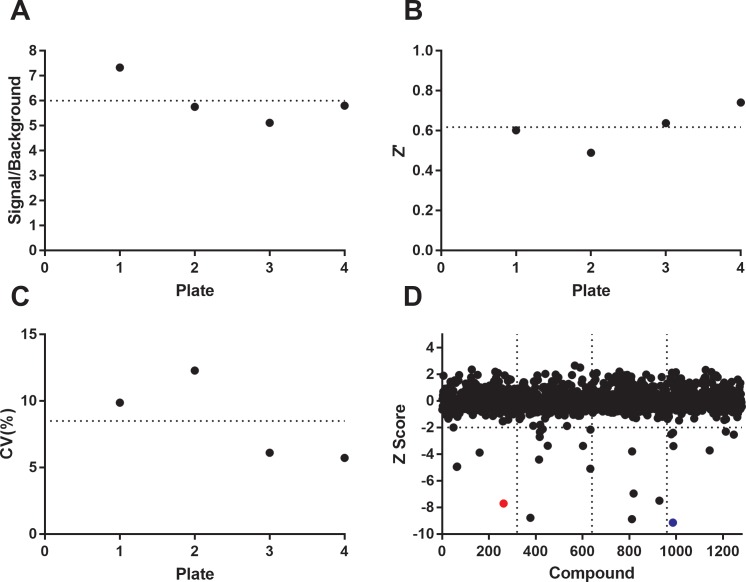
Fig 5. Assay validation and LOPAC screening results.
The LOPAC was screened to assess the degree to which Promega’s ADP-Glo Max assay can be used to measure IP6K1 activity in a high-throughput manner. (A) Signal to background ratio represents the DMSO control divided by 100μM Myricetin inhibition control. Signal/background = 6.00±0.47. (B) Z’ factor = 0.62±0.05. (C) CV = 8.50±1.57%. (D) Plot of Z score for LOPAC compounds. Compounds below Z of -2.0 are considered hits. Myricetin is highlighted in red and 6-Hydroxy-DL-Dopa in blue. Data presented here are representative of a single LOPAC screen where each compound is screened at one 10μM concentration.

