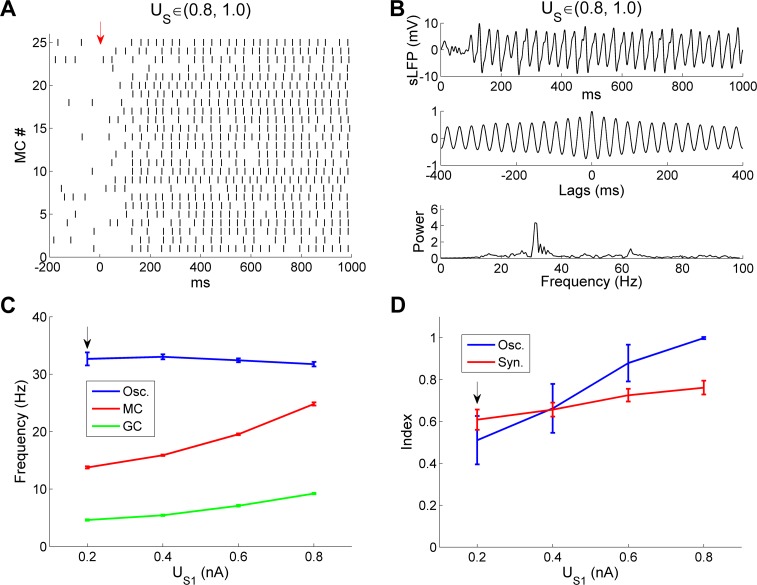
Fig 14. OB gamma oscillations are robust to variation in the steady-state lower bound of afferent input.
A: Raster plot of MC spikes when the steady-state lower input bound (US1) was increased fourfold, from 0.2 nA to 0.8 nA. The red arrow designates the onset of odor input. B: Simulated LFP (top) during odor presentation, with autocorrelation (middle) and frequency power spectrum (bottom), after the steady-state lower input bound (US1) was increased to 0.8 nA. C: Average odor-evoked MC and GC firing rates and sLFP frequency as functions of the steady-state lower input bound (US1). D: Synchronization and oscillation indices as functions of the steady-state lower input bound (US1). In these simulations, the steady-state upper input bound was maintained at its default (1.0 nA). The default lower input bound was 0.2 nA (indicated by black arrows in C, D). Error bars denote standard deviations (SD).

