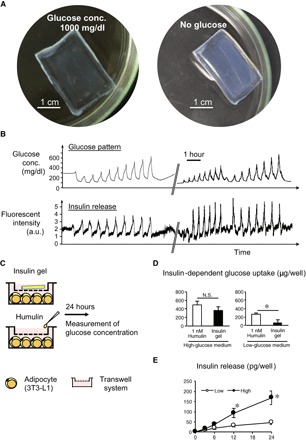
Fig. 2. Characterization of the glucose-responsive gel in vitro.

(A) Images of a smart gel formed in a macroscopic slab shape equilibrated under hyperglycemic (1000 mg/dl) (left) and no-glucose (right) conditions. (B) Release experiment. Top: Temporal patterns of glucose fluctuation challenged through a HPLC setup under physiological conditions (pH 7.4; 37°C; 155 mM NaCl). Bottom: Time course change in fluorescence intensity of fluorescein isothiocyanate (FITC)–labeled bovine insulin released from the gel. The break in the x axis indicates an overnight interval between two experiments during which the gel was kept under constant flow (1 ml/min) of phosphate-buffered saline (PBS) containing glucose (100 mg/dl). a.u., arbitrary units. (C) Protocol for in vitro glucose-uptake assessment using differentiated 3T3-L1 adipocytes. (D) Insulin-dependent glucose uptake by the adipocytes. N.S., not significant. (E) Amount of cumulative insulin release in the culture. *P < 0.05. n = 4.
