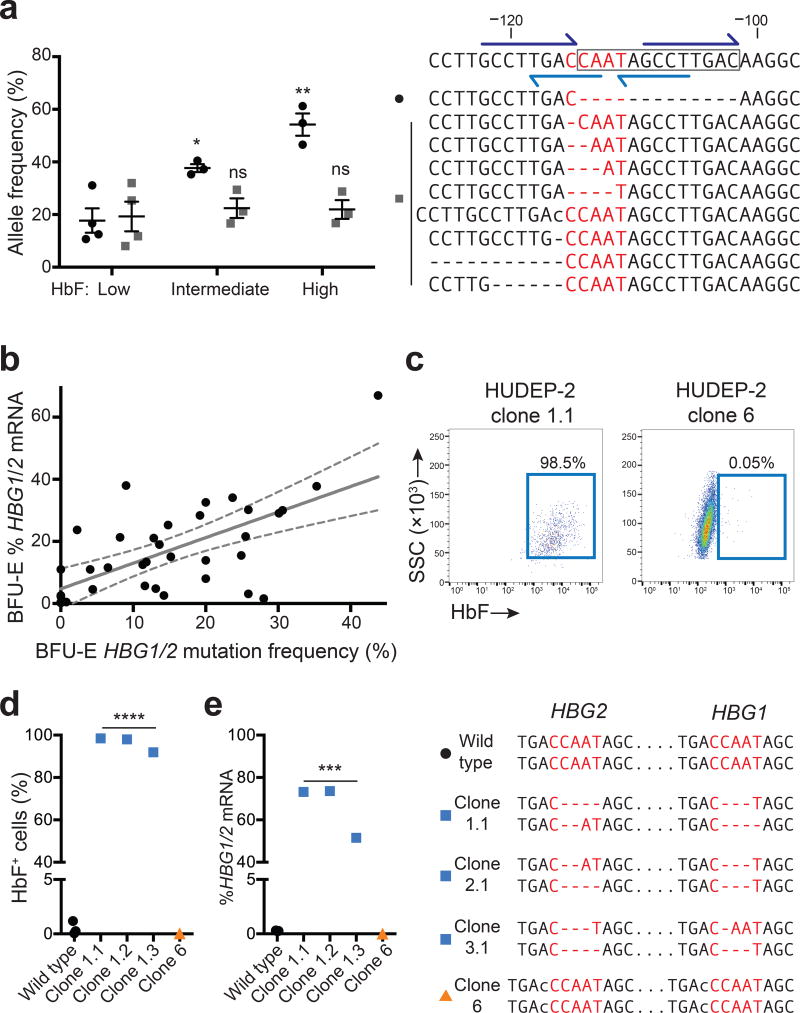
Figure 2. Spectrum of γ-globin-inducing mutations caused by Cas9 and gRNA-1.
(a) Normal adult CD34+ cells were edited with Cas9/gRNA-1 lentivirus, differentiated into RBCs, FACS-purified according to HbF immunostaining intensity (low, intermediate or high) and analyzed for on-target mutations. The wild type sequence is shown on the top left with the 13-nt HPFH deletion boxed and the CCAAT box in red. Dark blue half arrows show flanking 8-nt repeats; light blue show the DR element. The top nine mutant alleles (of more than 40 total indels identified) are shown below. Dashes indicate nucleotide deletions and lower-case letters insertions. In the graph at right, black dots denote the 13-nt HPFH deletion, which occurred at the highest frequency; gray squares show the combined frequencies of the eight next common mutations. Each symbol represents an independent experiment. * P < 0.05, ** P < 0.01 by unpaired t-test.
(b) CD34+ cells were electroporated with Cas9/gRNA-1/GFP expression plasmids. GFP+ cells were FACS purified and seeded into methylcellulose. Burst forming unit-erythroid (BFU-E) colonies were analyzed for globin mRNAs and HBG1/HBG2 mutations. All colonies were mosaic for mutations; the total HBG [(HBG1 + HBG2)/2 × 100] mutation frequency for each colony is plotted against %HBG1/2 mRNA [γ / (γ+β)]. Regression analysis shows best-fit line as solid gray (y = 0.82x + 4.8, r2 = 0.41, P < 0.0001, n = 35 colonies from three experiments) and 95% confidence intervals as dashed gray. See also Supplementary Figs. 4a and 5.
(c) HUDEP-2 cells were electroporated with Cas9/gRNA-1/GFP plasmid and cloned. HbF immunostaining is shown for two representative clones with different mutations (see also panel (d) and Supplementary Fig. 6).
(d–e) Characterization of genome edited HUDEP-2 clones. The HBG1 and HBG2 genotypes corresponding to each clone is shown on the right, according to the convention used in panel (a); all clones are homogenous for the indicated mutations. *** P < 0.001, **** P < 0.0001, ns = not significant by unpaired t-test.

