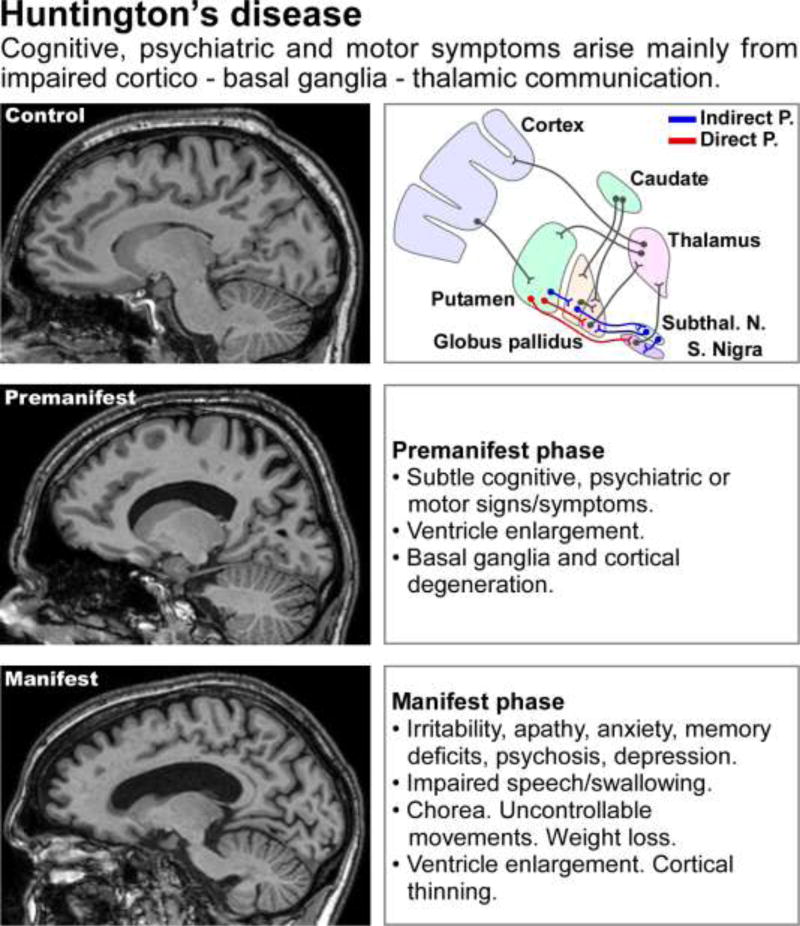
Figure 2. Imaging and clinical manifestations of Huntington’s disease.
Top row: MRI scan from a healthy control subject (left) and a scheme of the connectivity between cerebral cortex, basal ganglia and thalamus, indicating the indirect and direct pathways, the balance of which is thought to be altered in HD (right). Subthal. N. = subthalamic nuclei, S. Nigra = substantia nigra. Middle and bottom rows: MRI scans from a subject in the pre manifest stage of the disease (CAG length: 42; middle left) and a subject in the manifest stage of the disease (CAG length: 43; bottom left), and descriptions of the most common clinical findings at each stage (middle and bottom right). The MRI images are from the TRACK-HD study [23], courtesy of Dr. Sarah Tabrizi (University College of London).

