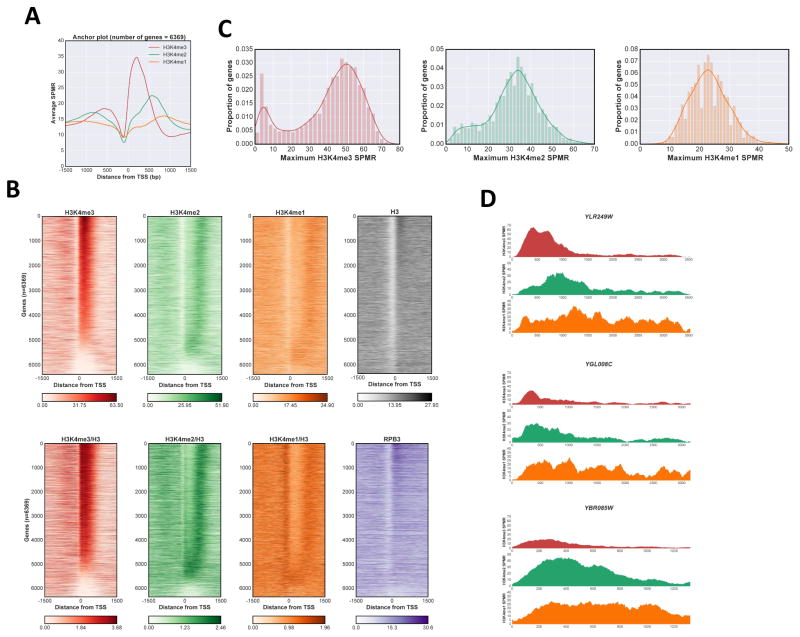
Figure 1. Distribution of H3K4me states in S.cerevisiae.
A Anchor plot of H3K4me states centered at the transcription start site (TSS) for RNApII transcripts. ChIP-Seq SPMR (sequence tags per million reads) values for nucleotide positions between −1500 and +1500 were averaged and plotted; red, H3K4me3; green, H3K4me2; orange, H3K4me1. B Heat maps of H3K4me states. SPMR values were mapped for individual RNApII transcriptional units and stacked in order of calculated maximum value for H3K4me3 peaks associated with that TSS (see methods). Color code for H3K4me states is as in panel A, with histone H3 in gray, and Rpb3 in purple. Upper panels and Rpb3 show total reads, while lower H3K4 methylation panels show values normalized to total H3. C Kernel density estimation plot and histogram of H3K4me maximum values. Maximum values were calculated for each methylation state at individual genes and plotted both as an histogram representation and a kernel density estimation plot. Color codes as in panel A. D Representative ChIP-Seq tracks. SPMR values for H3K4me3, me2 and me1 are plotted from 200 bp upstream of the TSS to 200 bp downstream of the transcription termination site for YLR249W, YGL008C and YBR085W. Color code as in panel A. See also Fig S1.

