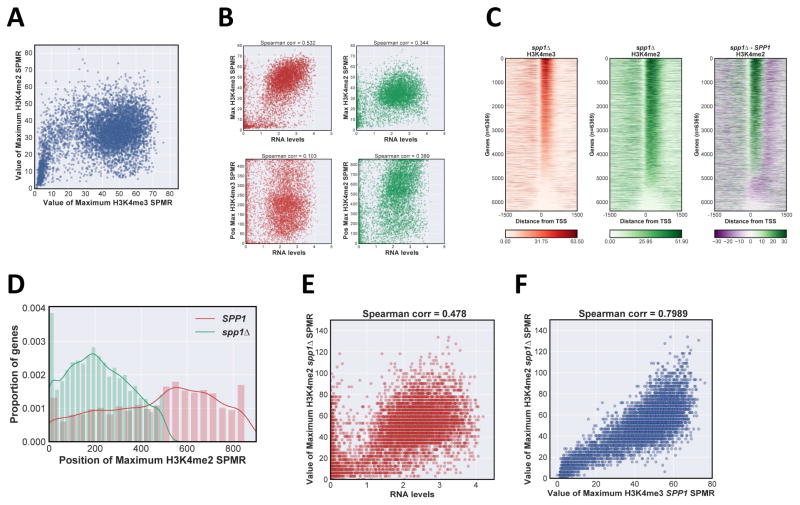
Figure 2. Effects of transcription rate and COMPASS activity on H3K4me distribution.
A Scatter plot of H3K4me3 versus H3K4me2 maximum SPMR values, with each individual transcription unit represented by a spot. B Scatter plot of relation between H3K4me properties and normalized RNA transcript levels (Xu et al., 2009; http://steinmetzlab.embl.de/NFRsharing/). For each gene, maximum peak value (upper panels) and position (lower panels) for H3K4me3 (left panels, red) and H3K4me2 (right panels, green) were plotted on the y-axis versus RNA levels (log2 scale) on the x-axis. Spearman correlation coefficient is above each plot. C Heat maps of H3K4me3 and H3K4me2 ChIP-Seq signal in spp1Δ. SPMR values were mapped for individual RNApII transcriptional units and stacked in order of H3K4me3 maximum value as in Fig 1B, right panel corresponds to the difference heat map between SPP1 and spp1Δ strains. D Distribution of H3K4me2 peak positions in SPP1 and spp1Δ strains. Position of maximum SPMR value for each gene was calculated and plotted as a kernel density estimate plot using the same number of total bins: red, SPP1; green spp1Δ.E Scatter plot of maximum H3K4me2 value in spp1Δ versus RNA transcript levels (log2 scale). F Scatter plot of maximum H3K4me2 value in spp1Δ versus maximum H3K4me3 in SPP1 cells. See also Fig S2.

