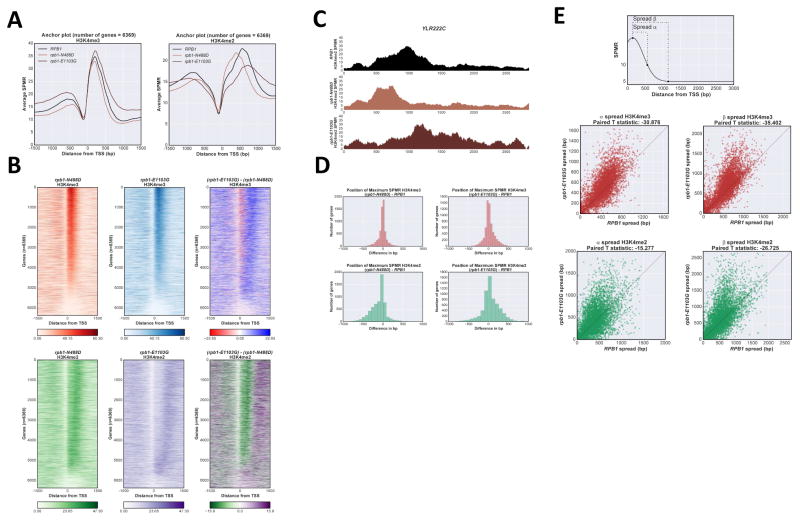
Figure 3. H3K4me distribution is sensitive to RNApII elongation rate.
A Anchor plot of H3K4me3 and me2 states in RPB1 (black), rpb1-N488D (“slow” elongation, light brown) and rpb1-E1103G (“fast” elongation, dark brown) strains, averaged and plotted as in Fig 1A. B Heat map of H3K4me3 and me2 states in rpb1-N488D and rpb1-E1103G strains. Heat maps were created as described in Fig 1B, ordered according to H3K4me3 values in RPB1 cells. Upper panels H3K4me3; lower panels H3K4me2; right panels show calculated differences between rpb1-N488D and rpb1-E1103G matrixes. C ChIP-Seq tracks for H3K4me2 on representative gene YLR222C (+/− 200bp from transcribed region) in RPB1, rpb1-N488D, and rpb1-E1103G strains. Color code as in panel A. D Histogram of H3K4me peak position shifts (mutant - wild type) between RPB1 and rpb1-N488D (left panels) or rpb1-E1103G (right panels). H3K4me3 (upper panels), H3K4me2 (lower panels). E Spread of H3K4me3 and H3K4me2 in rpb1-E1103G strain. Distance was calculated between the position of maximum SPMR for each H3K4me state and the position at which the SPMR drops to 10, α; or 5, β (top panel). Paired T-test statistic appears above each plot. See also Fig S3.

