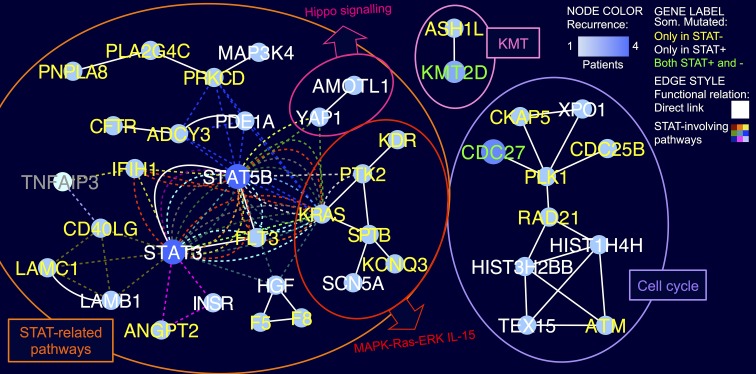
Figure 1. Core LGL leukemia mutation network.
The network shows the functional relations of genes somatically mutated in LGLL patients, according to the integration of KEGG and Reactome pathway topologies. Network nodes represent mutated genes, with the node and label colors indicating respectively the recurrence in the cohort, and if the gene was mutated only in STAT-mutation-positive (STAT+), only in STAT-mutation-negative (STAT−), or in both patient groups, as shown in the legend (TNFAIP3 is shown in grey as not mutated in the cohort). White solid lines indicate direct interactions and colored dashed lines connect genes participating in pathways including STAT3 and/or STAT5B.

