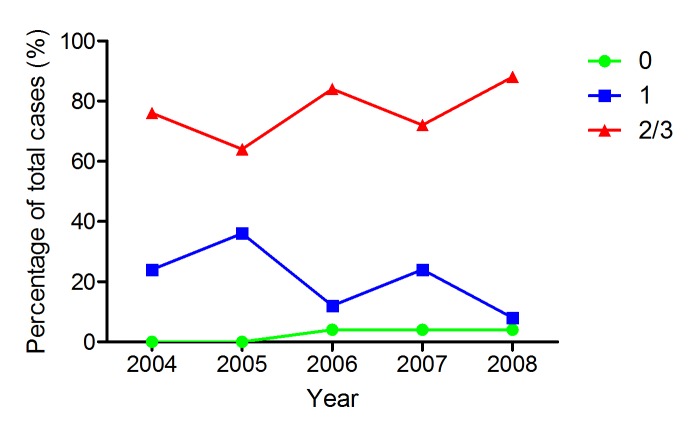
Figure 5. PPIB expression in TMA cores in a CRC series by block age of the donor FFPE sample.
Almost as many cases have moderate or high levels of expression in 2004 as in 2008. The rate of negative cores is actually higher in 2008 but still very low as a percentage of total cases. Green – PPIB score of 0; Blue – PPIB score of 1; Red – PPIB score of 2/3.

