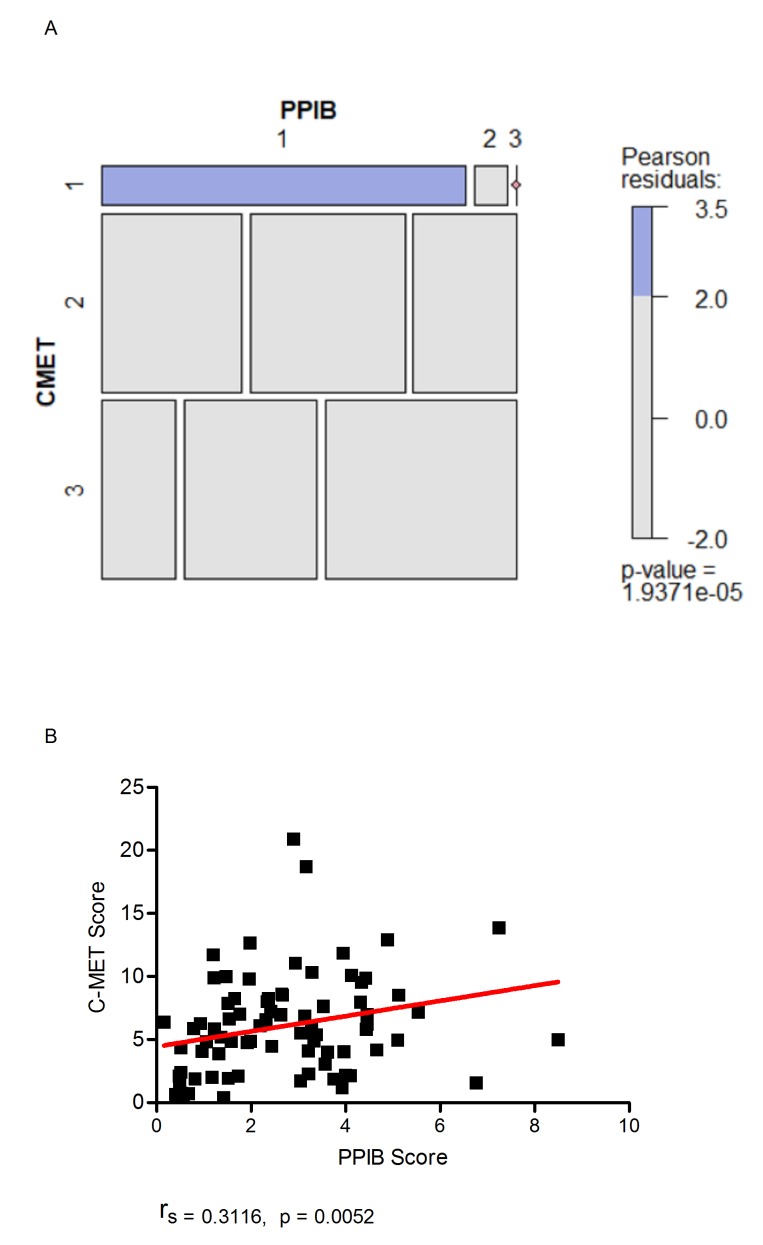
Figure 7.
Mosaic plot (A) demonstrating individual contributions of categorical PPIB and c-MET scores with Pearson residual base shading. A p value of less than 0.05 was considered significant. Correlation plot (B) demonstrating the relationship of digital scores generated for c-MET to PPIB when a manual PPIB score of 1 was given. Correlation was calculated using Spearman’s Rank.

