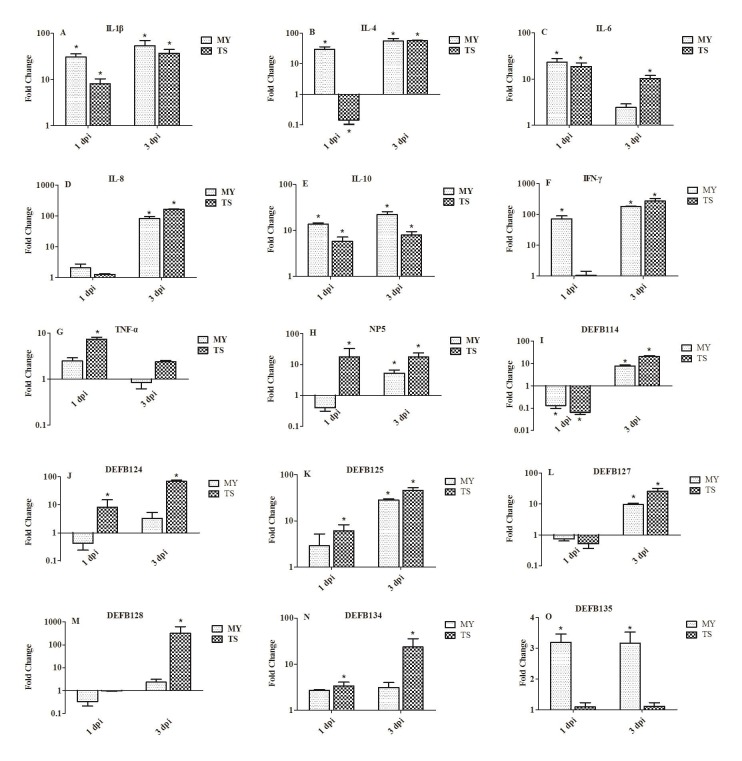
Figure 6. Expression profiles of immune-related genes in the liver of rabbits at 1 and 3 d postinfection.
Image A. shows IL-1β, B. IL-4, C. IL-6, D. IL-8, E. IL-10, F. IFN-γ, G. TNF-α, H. NP5, I. DEFB114, J. DEFB124, K. DEFB125, L. DEFB127, M. DEFB128, N. DEFB134, and O. DEFB135. Fold change was calculated from the gene expression of two groups of infected rabbits compared with that of control group. Bars represented the means ± SDs of three independent experiments (five rabbits per experiment); significant differences are indicated with an *.

