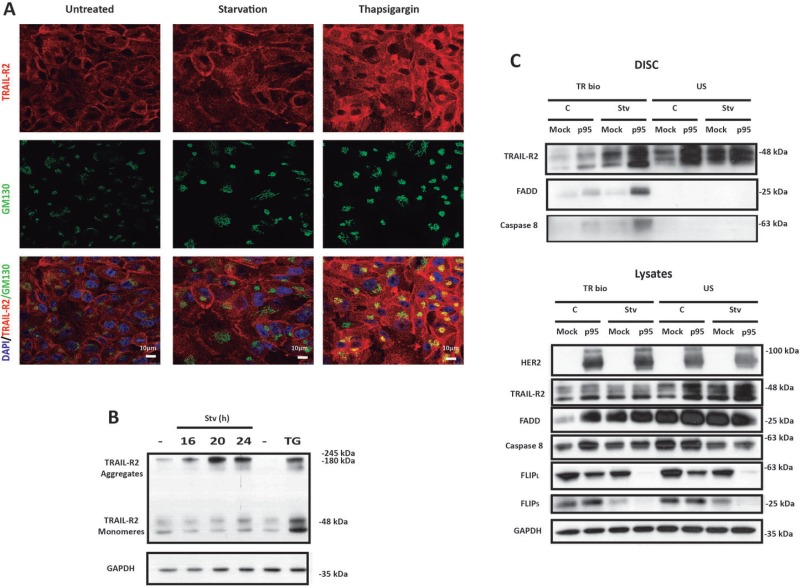
Figure 4. Metabolic stress induces TRAIL DISC formation at the plasma membrane in p95HER2/611CTF cells.
(A) Confocal microscopy analysis of TRAIL-R2 distribution in p95HER2/611CTF cells either incubated in complete or starvation medium or treated with 100 nM Thapsigargin for 21 h, in the presence of Z-VAD (20 µM). Merged images show labelling for DAPI, TRAIL-R2 and the Golgi Marker GM130. (B) p95HER2/611CTF cells were incubated either in complete or starvation medium for the indicated times, or treated with 100 nM Thapsigargin for 16 h before collecting samples to determine TRAIL-R2 levels. (C) Mock or p95HER2/611CTF cells were cultured either in complete or starvation medium, in the presence of Q-VD (20 µM) for 24 h prior to incubation on ice with bio-TRAIL (1 µg/ml) for 60 min. Unstimulated receptor controls (US) represent the addition of bio-TRAIL to an equivalent volume of lysate isolated from cells kept on ice without bio-TRAIL. DISC isolation and analysis was performed as described in Materials and Methods (upper panel). Lower panel shows western blot analysis of proteins in cell lysates. Data shown are representative of 3 independent experiments.

