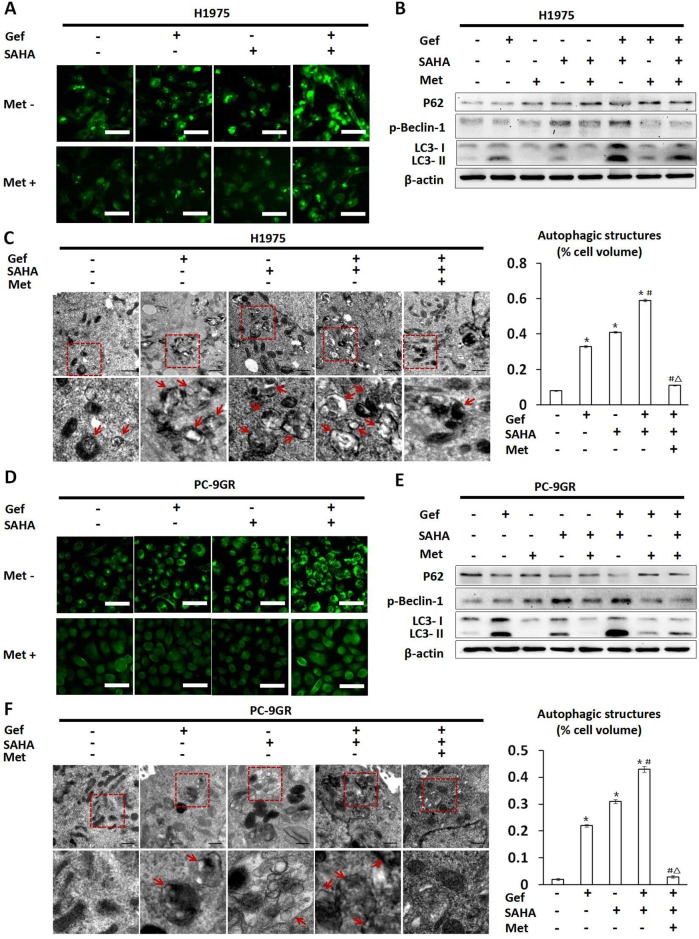
Figure 5. Changes in autophagy seen in H1975 and PC-9GR cells treated with vorinostat and/or gefitinib with/without metformin.
H1975 and PC-9GR cells were treated with vorinostat (0.5 μM), metformin (1 mM) and gefitinib (IC25) alone or in combination for 48 hr. In (A) H1975 and (D) PC-9GR cells, fluorescence microscopic imaging showed that vorinostat and gefitinib alone increased punctate fluorescence. In addition, vorinostat and gefitinib cotreatment greatly augmented punctate fluorescence, while metformin reversed increases in punctate fluorescence that were otherwise induced by vorinostat and/or gefitinib treatment. Scale bars: 30μm. (B) and (E) showed whole cell protein lysates from H1975 and PC-9GR cells under differential treatment were immuno-blotted with antibodies as indicated respectively. The expression of β-actin was used as a loading control. (C) and (F) Representative autophagic structures and quantitative data obtained by transmission electron microscopy in H1975 and PC-9GR cells, respectively. Scale bars: 0.5μm. Similar results were obtained in three independent experiments. *p < 0.001 as compared with the control (untreated) cells; #p < 0.001 as compared with gefitinib or vorinostat treatment alone; Δp < 0.001 as compared with gefitinib combined with vorinostat. Gef: gefitinib; SAHA: vorinostat; Met: metformin.

