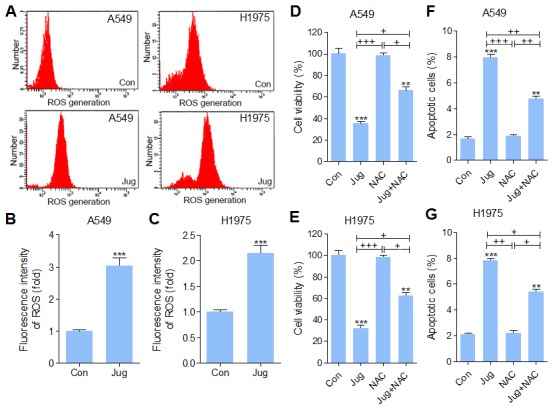
Figure 6. Juglanin enhanced ROS production in lung cancer cells.

(A) A549 and H1975 cells were pre-treated with 40 μM juglanin for 24 h. Then, the ROS generation was calculated. The representative images were shown here. The quantification of ROS production in (B) A549 and (C) H1975 cells was represented as relative fluorescent intensity. (D) A549 and (E) H1975 cells were treated with 10 mM NAC (ROS scavenger) for 2 h, and 40 μM juglanin for 24 h, or the combination of NAC for 2 h during exposure to juglanin for 24 h. Then, the cell viability was determined by MTT analysis. (F) A549 and (G) H1975 cells were administered with 10 mM NAC for 2 h, and 40 μM juglanin for 24 h, or NAC for 2 h during juglanin treatment for 24 h, followed by apoptotic cells determination through flow cytometry assay. The data are presented as mean ± S.E.M. of three separate experiments performed in duplicate. ** P < 0.01 and *** P < 0.001 compared to Control group (Con) without any treatment.+ P < 0.05, ++ P < 0.01 and +++ P < 0.001 were considered with significant difference. n.s. referred to no significant difference.
