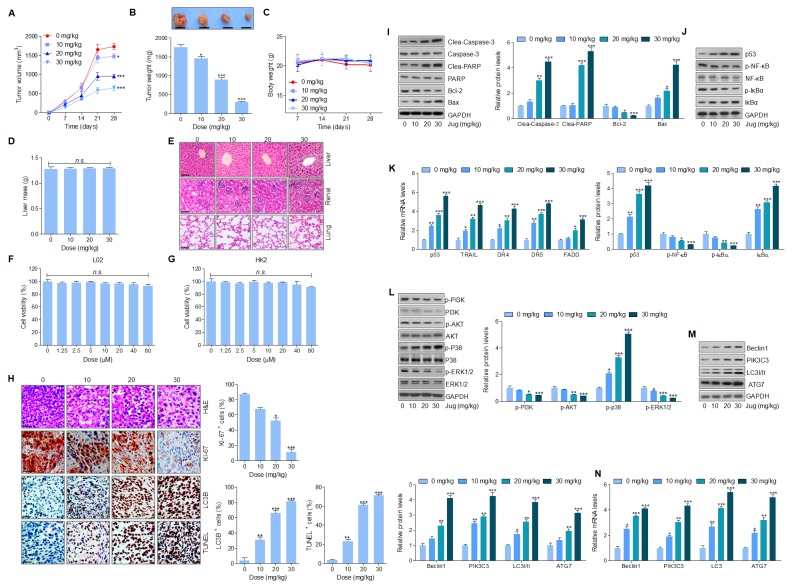
Figure 8. Juglanin treatment suppressed tumor xenograft growth in vivo in a subcutaneous tumor model.
The lung cancer cell A549 was subcutaneously injected into the dorsal flanks of 40 athymic nude mice. When the size of tumor reached to about 50 mm [3], the experimental animals were i.p. with 0, 10, 20 and 30 mg/kg juglanin each day for consecutive 4 weeks. (A) The tumor volume was measured every two days. (B) At the end of the in vivo study, the tumor from each group was weighed. (C) The body weight of the nude mice was analyzed. (D) At the end of the study, the liver from each mouse was obtained and weighed. (E) 24 athymic nude mice athymic nude mice were only treated with juglanin under different conditions (0, 10, 20 and 30 mg/kg) for consecutive 4 weeks. Finally, the representative images of liver, renal and lung sections analyzed by H&E staining were shown. (F) Liver normal cells L02 and (G) renal normal cells HK2 were treated with different concentrations (0,1.25, 2.5, 5, 10, 20, 40 and 80 μM) of juglanin for 24 h. Then, the cell viability was calculated through MTT assays. (H) The analysis of tumor tissue samples KI-67, autophagy (LC3B) and apoptosis (TUNEL) after treatment with juglanin under different conditions. The quota of tumor KI-67 positive cells, autophagy levels and apoptosis. The ratio of different positive cells was calculated from three fields with the highest density of positive-expressed cells in every section form each group. (I) Western blot analysis was used to calculate Caspase-3, PARP, Bcl-2 and Bax protein levels in the tumor tissue samples obtained from the mice under different conditions. The quantification of these proteins was shown. (J) p53, p-NF-κB and p-IκBα protein levels were calculated through western blotting analysis. (K) RT-qPCR assays were carried out to determine p53, TRAIL, DR4, DR5 and FADD mRNA levels in tumor tissue specimens. (L) PI3K, AKT, p38 and ERK1/2 phosphorylation was assessed by western blotting analysis. (M) Beclin1, PIK3C3, LC3I/II and ATG7 protein expression levels were measured via immunoblotting analysis. (J) The quantification of Beclin1, PIK3C3, LC3I/II and ATG7. (N) Beclin1, PIK3C3, LC3I/II and ATG7 gene levels were evaluated by RT-qPCR analysis. The results are presented as mean ± S.E.M. n=10. * P < 0.05, ** P < 0.01 and *** P < 0.001 compared to Control group (Con) without any treatment.

