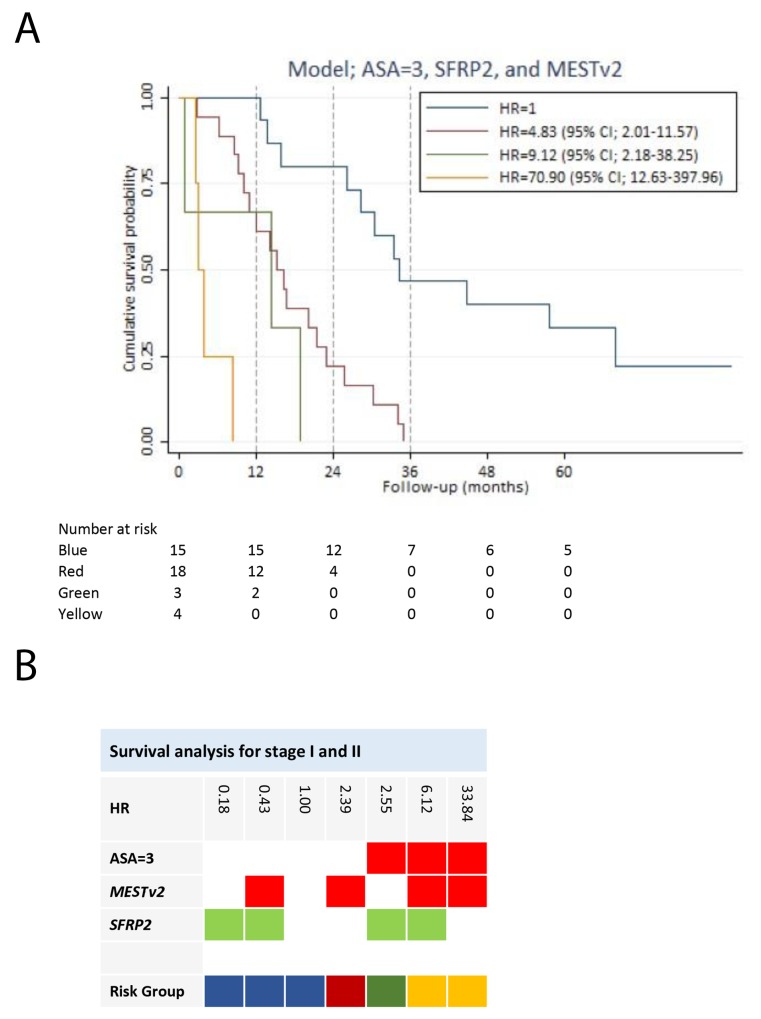
Figure 4. Survival analysis for stage I and II pancreatic adenocarcinoma patients.
(A) Survival prediction model for the stage I and II patients, developed by multivariable Cox regression analysis using backward stepwise selection. Patients in risk group 2, risk group 3 and risk group 4 had a HR of 4.83 (95% CI; 2.01-11.57), 9.12 (95% CI; 2.18-38.25) and 0.90 (95% CI; 12.63-397.96), respectively, compared to risk group 1. (B) The gene combination together with the corresponding HR is illustrated for the survival prediction model (ASA=3, MESTv2, and SFRP2). Blue: Risk group 1. Red: Risk group 2. Green: Risk group 3. Yellow: Risk group 4. Note: Stage is in accordance with The American Joint Committee on Cancer stage classification.

