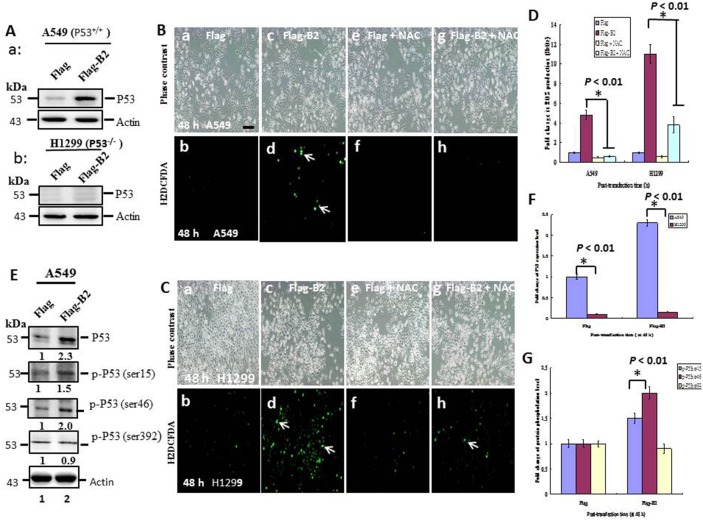
Figure 2. Targeting of B2 protein to mitochondria induces stronger ROS production in H1299 cells than A549 cells.
(A) Immunoblotting shows the expression of P53 in A549 cells (P53+/+) and H1299 cells (P53—/—) at 48 h post-transfection, with actin used as an internal control. ROS production (arrows) by A549 cells (B) and H1299 cells (C) at 48 h post-transfection. In B and C, FLAG, negative control (a and b); FLAG-B2 (c and d); FLAG + N-acetylcysteine (NAC) (e and f), FLAG-B2 + NAC (g and h). Green fluorescence indicates ROS production. Scale bar = 20 μm. (D) Quantification of the data in B and C. Error bars represent the SEM of 3 independent experiments. All data were analyzed using a paired or unpaired Student’s t-test, as appropriate. *p < 0.01 indicates statistical significance. (E) Identification of P53 expression and phosphorylation sites in A549 cells by western blot analysis. (F and G) Quantification of the results in A and E, respectively. Error bars represent the SEM of 3 independent experiments. All data were analyzed using a paired or unpaired Student’s t-test, as appropriate. *p < 0.01 indicates statistical significance.

