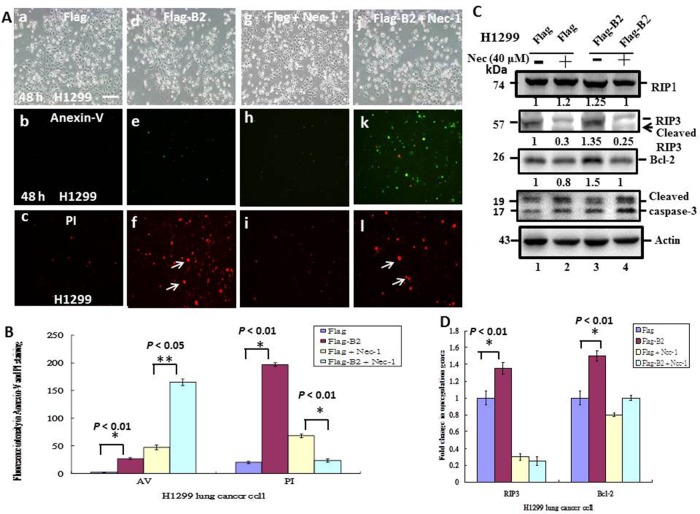
Figure 5. Blockage of RIP3 function switches B protein-transfected H1299 cells from necroptosis to apoptosis.
(A) Representative phase-contrast-fluoresence images of the FLAG group (a-c), FLAG-B2 group (d-f), FLAG + Nec-1 group (g-i) and the FLAG-B2 + Nec-1 group (j-l), with staining by Annexin-V-FITC (b, e, h, and k) and PI (c, f, i, and l) at 48 h post-transfection. (B) Quantification of FITC and PI fluorescence. Error bars represent the SEM of 3 independent experiments. All data were analyzed using a paired or unpaired Student’s t-test, as appropriate. *p < 0.05 indicates statistical significance. (C) Influence of a necrosis inhibitor on expression of apoposis- and necrosis-related genes, based on western blot analysis at 48 h post-transfection. (D) Quantification of the western blotting results from C. Error bars represent the SEM of 3 independent experiments. All data were analyzed using a paired or unpaired Student’s t-test, as appropriate. *p < 0.01 indicates statistical significance.

