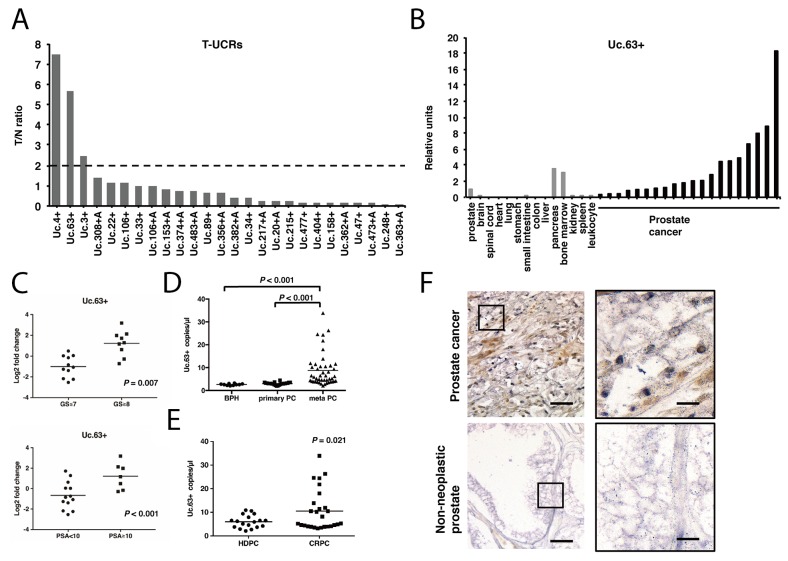
Figure 1. The expression of transcribed ultraconserved regions (T-UCRs) in prostate cancer (PC).
(A) The fold difference indicates the ratios of T-UCR expression in PC tissues compared with non-neoplastic tissues. (B) qRT-PCR analysis of the expression of Uc.63+ in 14 kinds of normal tissues and 20 PC samples. (C) Scatter plot diagrams showing the association between the expression of Uc.63+ and clinicopathological findings (Gleason score [GS], prostate-specific antigen [PSA]). Statistical differences were evaluated with the Mann-Whitney U-test. (D) Results of droplet digital PCR (ddPCR) for the expression of Uc.63+ in serum of patients with benign prostatic hyperplasia (BPH), primary PC (localized PC), and meta PC (PC with metastatic sites). Statistical differences were evaluated with the Mann-Whitney U-test. (E) Results of ddPCR for the expression of Uc.63+ in serum in hormone-dependent PC (HDPC) and castration-resistant PC (CRPC). Statistical differences were evaluated with the Mann-Whitney U-test. (F) In situ hybridization analysis for the expression of Uc.63+ in PC and non-neoplastic prostate. Representative imagines with low (left panels) and high (right panels) magnifications were shown. Scale bars, 50 μm for low magnification image (left panel); 10 μm for high magnification images (right panels).

