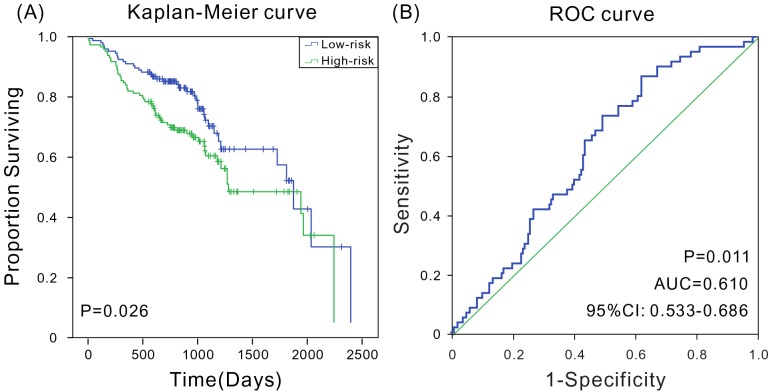
Figure 5. Kaplan-Meier and ROC analyses for the overall survival of patients from GSE65858.
(A) Kaplan-Meier survival curves show a correlation between the expression of six-mRNA signature model and overall survival of patients; (B) ROC curves show the sensitivity and specificity of the six-mRNA signature model in predicting the patient overall survival, AUC = 0.610 (P < 0.05).

