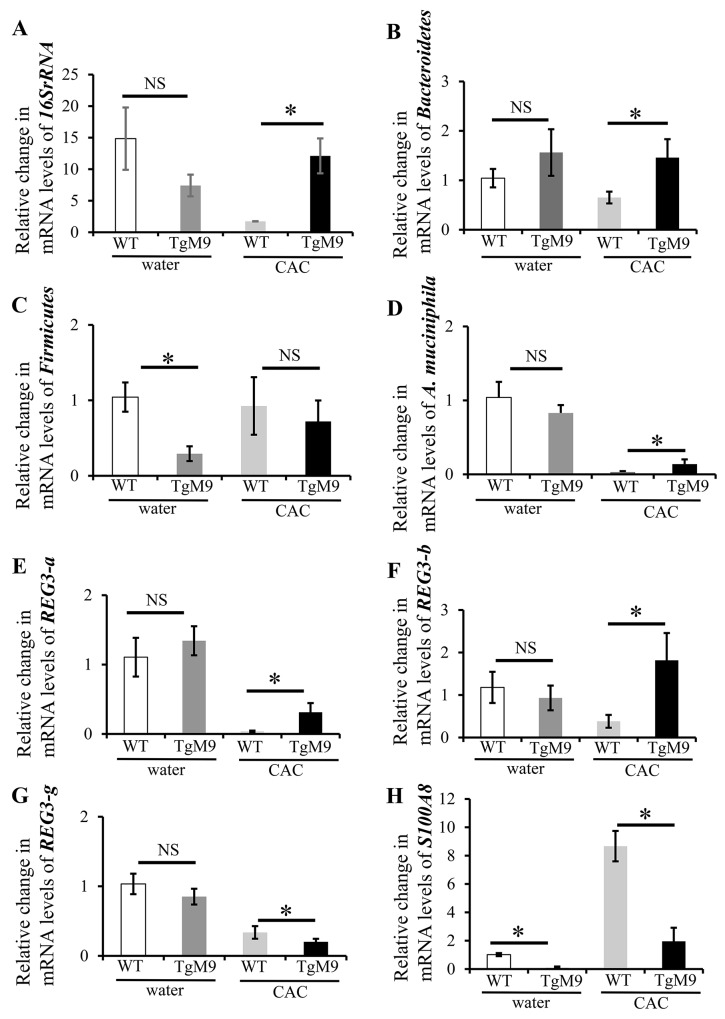
Figure 1. MMP9 in colonic epithelium attenuates microbiota depletion in CAC.
Bar graph representation of the QPCR analyses of different phyla of microbiota at mRNA levels in colonic mucosal strippings from WT and TgM9 mice treated with water or 3 cycles of 3% DSS. Relative mRNA expression levels of (A) universal bacteria, 16SrRNA (B) Bacteroidetes (C) Firmicutes (D) A. muciniphila (E) REG3-a (F) REG3-b (G) REG3-g and (H) S1008A. NS means non-significant. Each bar represents mean ± S.E., *p< 0.05.

