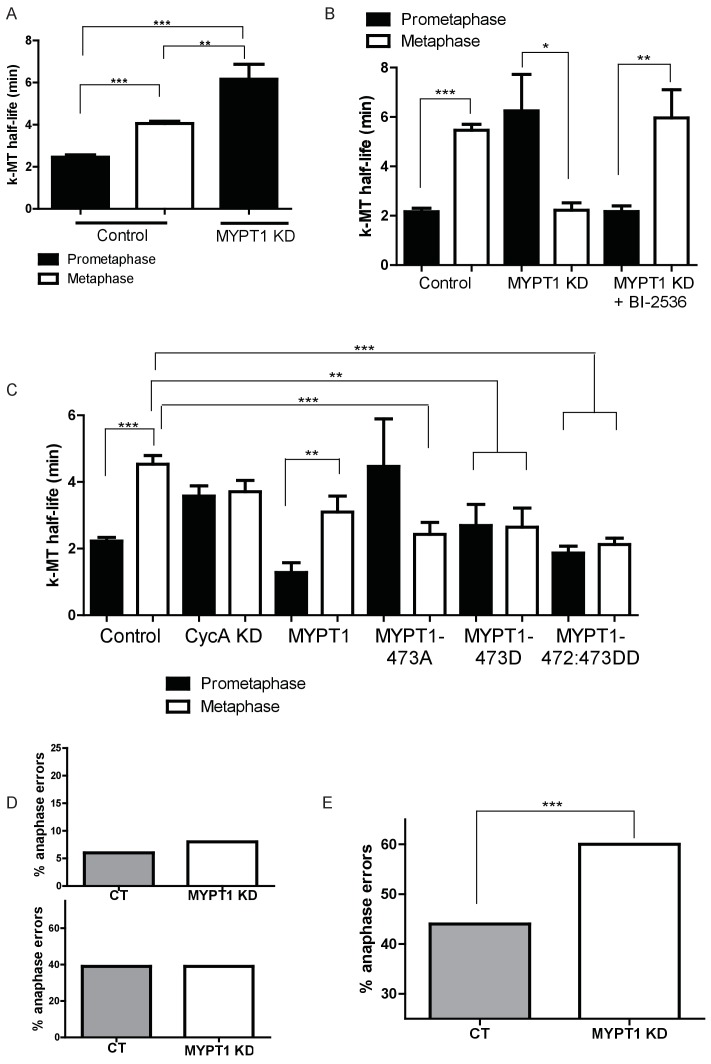
Figure 4. MYPT1 promotes efficient error correction by regulating Plk1.
(A) Microtubule turnover rates were measured and k-MT half-life was calculated from RPE1 cells before (Control) and after si-RNA-mediated MYPT1-knockdown (MYPT1 KD) in prometaphase and metaphase cells as indicated (n ≥ 10 cells/condition from ≥2 independent experiments. ***Indicates p<0.0001, **indicates p=0.0096, unpaired, two-tailed t-test. (B) Microtubule turnover rates were measured and k-MT half-life was calculated from U2OS cells before (Control) and after si-RNA-mediated MYPT1-knockdown (MYPT1 KD) and with the addition of the Plk1-specific inhibitor Bi-2536 in prometaphase and metaphase cells as indicated (n ≥ 15 cells/condition from ≥2 independent experiments. CT cells p<0.0001; MYPT1 KD cells p=0.04; MYPT1KD +BI-2536 p=0.0038; unpaired, two-tailed t-test). (C) Microtubule turnover rates were measured and k-MT half-life was calculated from U2OS cells before (Control) and after si-RNA-mediated Cyclin A2-knockdown (CycAKD) or transfection with plasmid containing either full-length MYPT1 (MYPT1), phosphonull (MYPT1-473A), phosphomimetic (MYPT1-473D) or tandem phosphomimetic (MYPT1-472:473DD) in prometaphase and metaphase cells as indicated (n ≥ 10 cells/condition in all conditions except MYPT1-473A metaphase where n = 9 cells). ***Indicates p<0.0001, **indicates p=0.004, unpaired, two-tailed t-test. (D) Fraction of anaphase cells displaying lagging chromosomes in RPE1 (Top) and USOS (Bottom) cells before (CT) and after si-RNA-mediated MYPT1-knockdown (MYPT1 KD) (n ≥ 300 anaphases/condition. p-values n.s., unpaired two-tailed t-test). (E) Fraction of anaphase cells displaying lagging chromosomes following release from monastrol treatment in U2OS cells before (Control) and after si-RNA-mediated MYPT1-knockdown (MYPT1 KD) (n ≥ 800 anaphases/condition from two independent experiments. p<0.0001, Chi square contingency analysis).
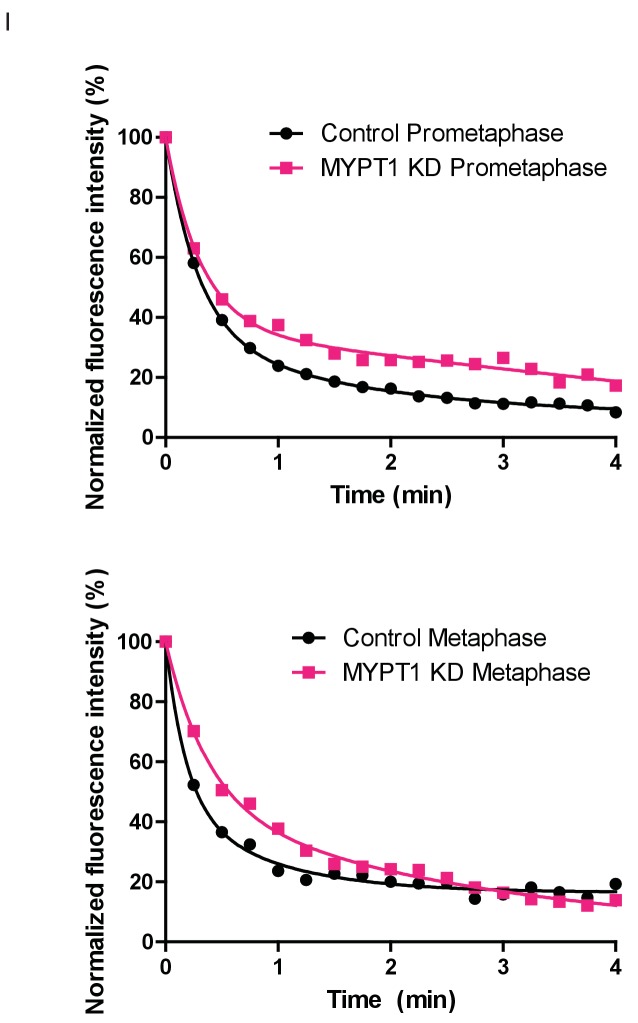
Figure 4—figure supplement 1. Fluorescence Dissipation After Photoactivation (FDAPA) Representative Curves From Microtubule Stability Measurements.
Figure 4—figure supplement 2. Calcium Stabilization Assay.
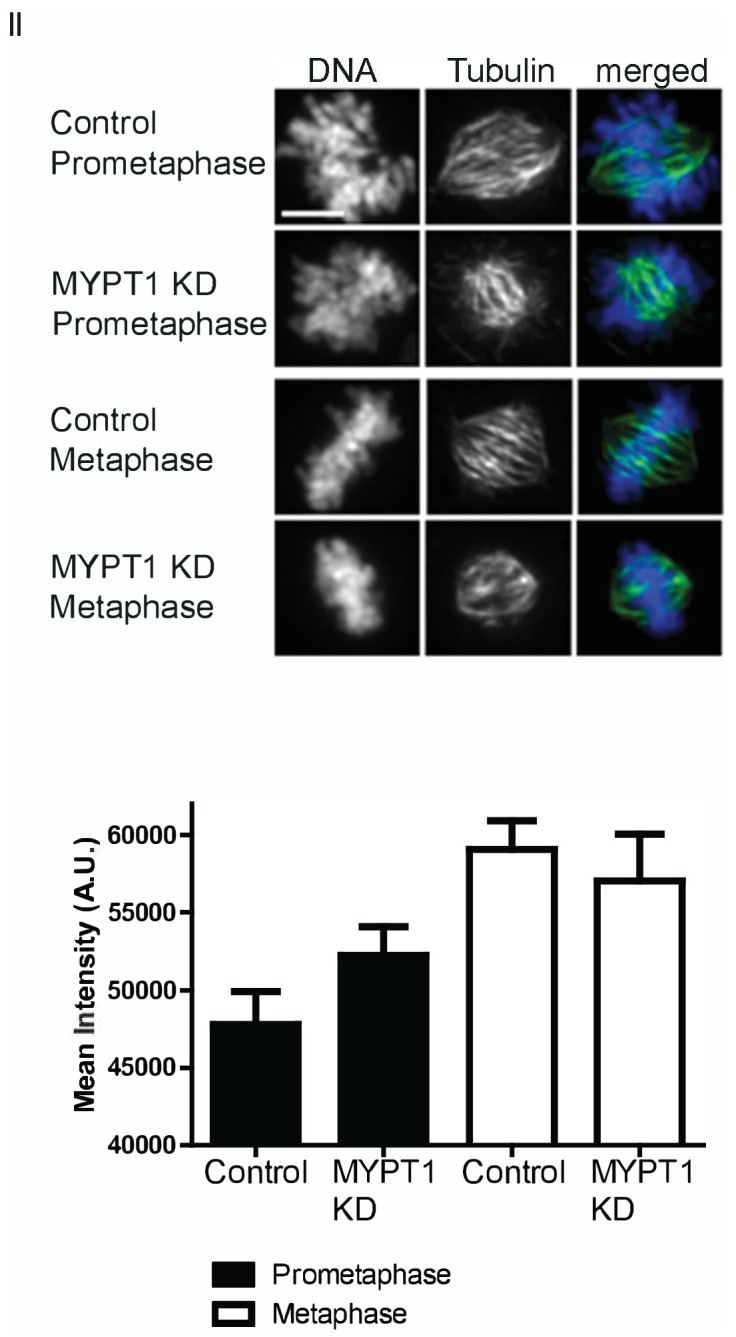
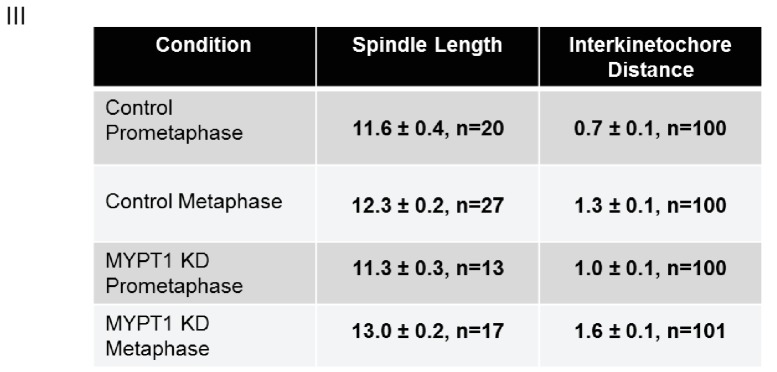
Figure 4—figure supplement 3. Quantifications of Other Mechanical Effects of MYPT1 in Mitotic Cells.
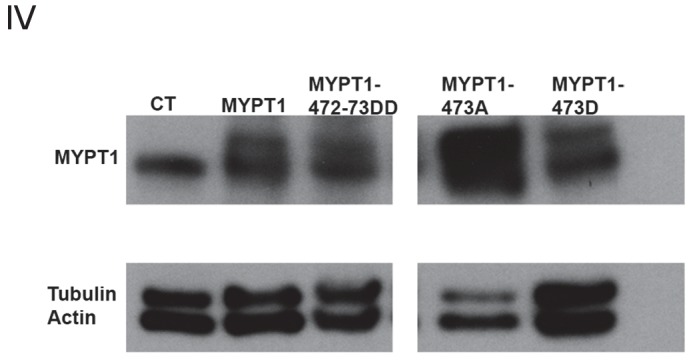
Figure 4—figure supplement 4. Analysis of Whole Cell Levels of Expression of Various MYPT1 Plasmids.
