. 2017 Nov 13;6:e29176. doi: 10.7554/eLife.29176

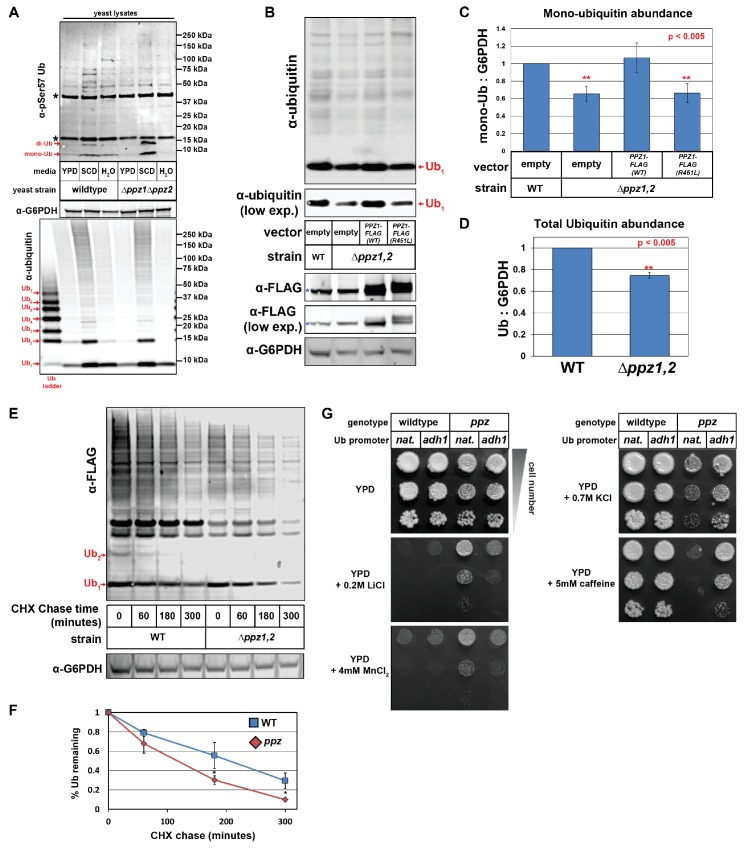
Figure 1. Ppz phosphatase activity is required for proper management of cellular ubiquitin.

(A) Immunoblot analysis using an α-phospho-Ser57 specific antibody to detect Ser57 phosphorylation of ubiquitin in yeast lysates. Yeast lysates from a SUB280 background, comparing wild-type cells (left three lanes) and ppz mutant cells (right three lanes) grown to mid log phase in YPD (‘YPD’), or shifted from mid log growth in YPD to minimal complete media for 6 hr (‘SCD’) or shifted to growth in water overnight (‘H2O’). Samples were resolved by SDS-PAGE and immunoblotted using antibodies that recognize total ubiquitin (bottom panel), G6PDH (middle panel), or phospho-Ser57 ubiquitin (top panel). For the total ubiquitin blot (bottom panel), a ubiquitin ladder was included as a standard for different unconjugated poly-ubiquitin species (red arrows). For the α–phospho-Ser57 ubiquitin blot (top panel), red arrows indicate species that are specific to Ser57 on ubiquitin and asterisks (*) indicate non-specific bands detected by the antibody, as illustrated in Figure 1—figure supplement 2. (B) The indicated yeast cells (SEY6210 background) containing either empty vector or PPZ1-FLAG vectors were analyzed for total cellular ubiquitin levels by immunoblot analysis. The blue asterisk indicates a background band detectable by FLAG antibody that is a MW similar to Ppz1-FLAG. (C) Quantification of mono-ubiquitin abundance in yeast cell lysates (SEY6210 background) from multiple biological replicates of the immunoblot shown in (B) (n = 5). (D) Total ubiquitin abundance was quantified in wild-type and ppz mutant cells expressing endogenously FLAG-tagged ubiquitin. Total cell lysates were analyzed by quantitative analysis of slot blots shown in Figure 1—figure supplement 3. (E) The indicated yeast cells were grown to mid-log phase and cell lysates were analyzed for total ubiquitin levels at the indicated time points following a cycloheximide (CHX) chase. (F) The results for (F) were quantified over multiple experiments (n = 3). (G) Analysis of yeast growth in the indicated conditions. In this experiment, the yeast ubiquitin gene was expressed from either native (pRPS31) or overexpression (pADH1) promoter was shuffled into the SUB280 strain background. Indicated yeast were plated in 10-fold serial dilutions on indicated plates. In all panels, double asterisk (**) indicates p<0.005 and single asterisk (*) indicates p<0.05.

Figure 1—source data 1. Results from SILAC-based quantitative comparison of the yeast phosphoproteome from wild-type (heavy) and Δppz1Δppz2 (light) cells.
Phosphorylation events that are elevated threefold or greater in Δppz1Δppz2 cells are shown. Also shown are phosphopeptides detected from Ppz1, which are present in wild-type cells and missing from Δppz1Δppz2 cells.
DOI: 10.7554/eLife.29176.008
Figure 1—source data 2. This spreadsheet contains the quantification and statistical analysis for mono-ubiquitin levels (Figure 1C), total ubiquitin levels (Figure 1D), and for ubiquitin degradation in a cycloheximide chase experiment (Figure 1F).
DOI: 10.7554/eLife.29176.009

Figure 1.

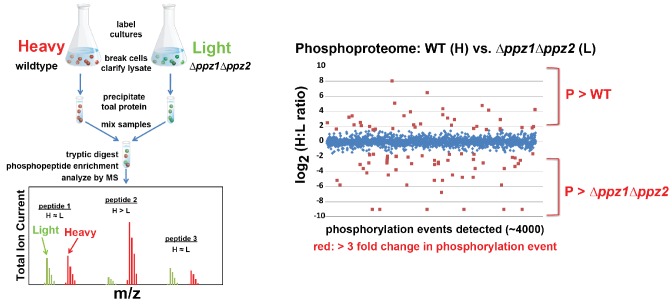
Figure 1—figure supplement 1. A SILAC-based quantitative comparison of the phosphoproteome in wildtype (heavy) and Δppz1Δppz2 (light) cells.

Figure 1—figure supplement 1.

The schematic on the left shows the experimental approach for quantitative analysis of the phosphoproteome in ppz mutant cells. The scatter plot on the right summarizes SILAC-based quantitative analysis of yeast phosphoproteomes comparing wildtype (heavy) and ppz mutant (light) cells. All phosphorylated peptides with a fold difference greater than three are colored red. Results of this analysis are tabulated in Figure 1—source data 1.
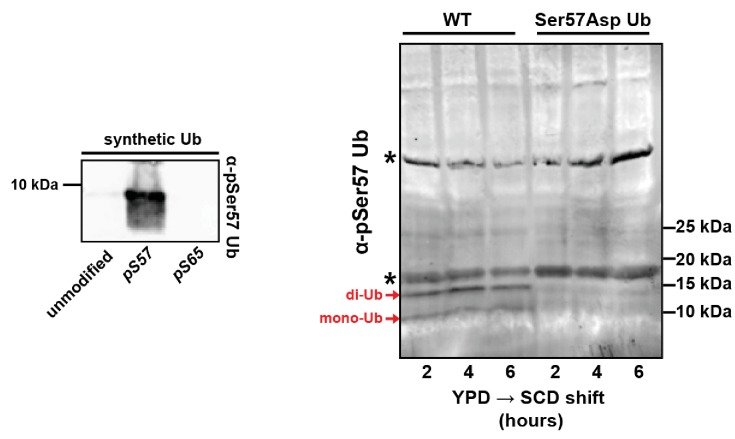
Figure 1—figure supplement 2. Analysis of antibodies recognizing pSer57 ubiquitin.

Figure 1—figure supplement 2.

The left panel shows immunoblot analysis of synthetic ubiquitin, phospho-Ser57 ubiquitin, and phospho-Ser65 ubiquitin using an α-phospho-Ser57-specific antibody. The right panel shows immunblot analysis using the same antibody to probe lysates from yeast expressing only wild-type ubiquitin or Ser57Asp ubiquitin. Many background bands are apparent but two low MW bands corresponding to mono- and di-ubiquitin are recognized by the antibody in a Ser57-specific manner.
Figure 1—figure supplement 3. Quantification of cellular ubiquitin levels by analysis of slot blots.
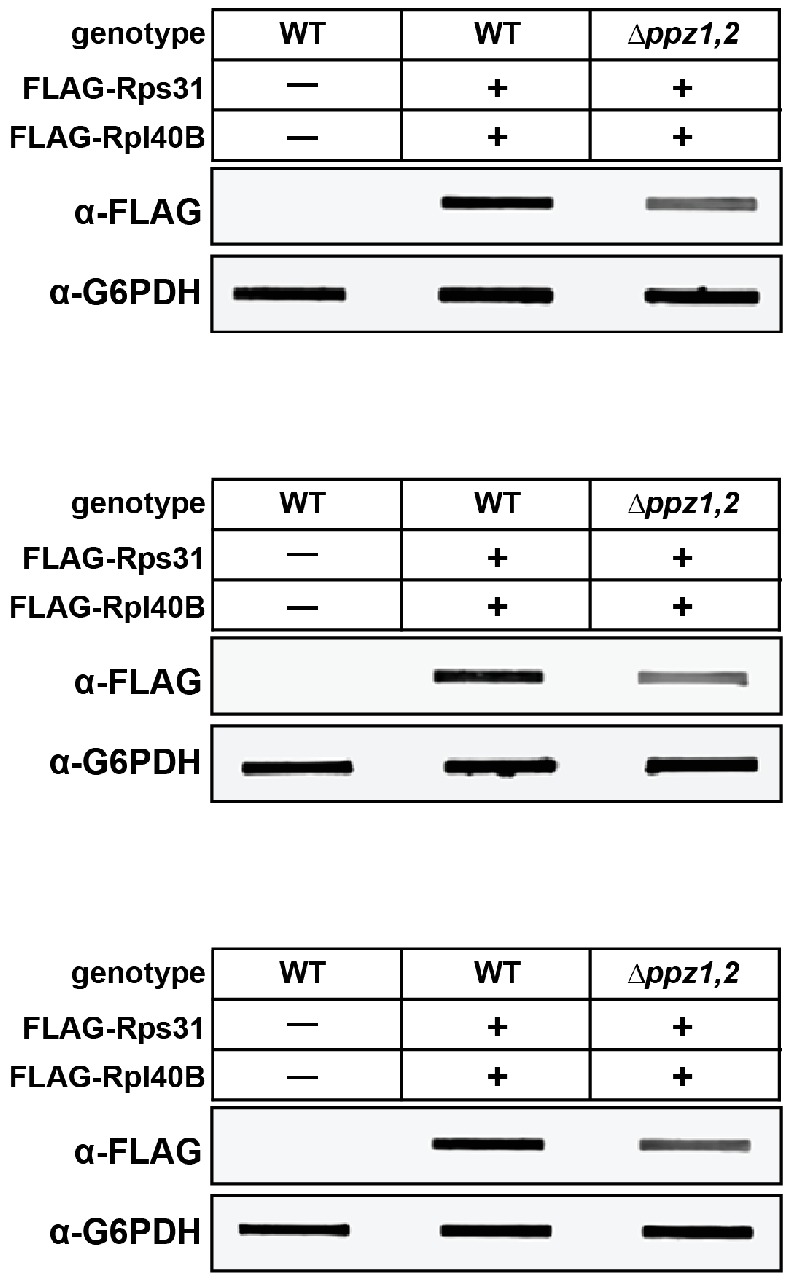
Figure 1—figure supplement 3.

Yeast strains (SEY6210 background) with endogenously FLAG-tagged ubiquitin (at the RPL40B and RPS31 loci with native promoter and terminator containing an N-terminal 3xFLAG tag) were grown to mid-log phase and precipitated in 10% cold TCA. Total cell lysates from solubilized pellets were bound to PVDF membranes using a vacuum manifold and immunoblotting analysis was performed as indicated. Three biological replicate experiments are shown.
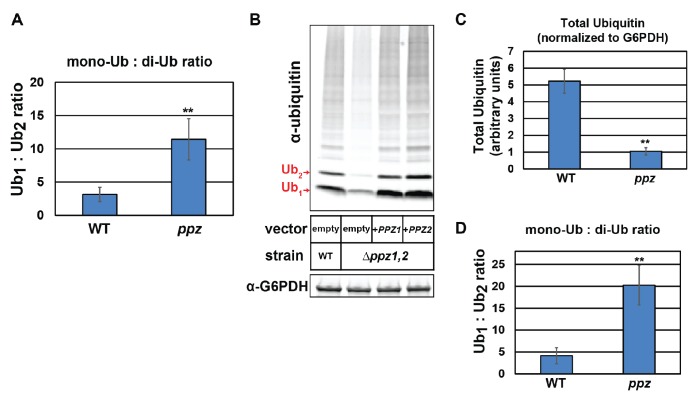
Figure 1—figure supplement 4. Characterization of ubiquitin levels and distribution in wild-type and Δppz1Δppz2 cells.

Figure 1—figure supplement 4.

(A) Using quantitative immunoblots mono-ubiquitin: di-ubiquitin ratios were measured in yeast lysates (SEY6210 background) and averaged over multiple experiments (n = 5). (B) The indicated yeast cells (SUB280 background) containing either empty vector or native PPZ1 or PPZ2 complementation vectors were analyzed for total cellular ubiquitin levels by immunoblot analysis. (C) Analysis of total ubiquitin in SUB280 yeast lysates from cells grown to mid-log phase in YPD. (D) Analysis of mono-ubiquitin: di-ubiquitin ratios were measured in yeast lysates (SUB280 background) and averaged over multiple experiments (n = 5).
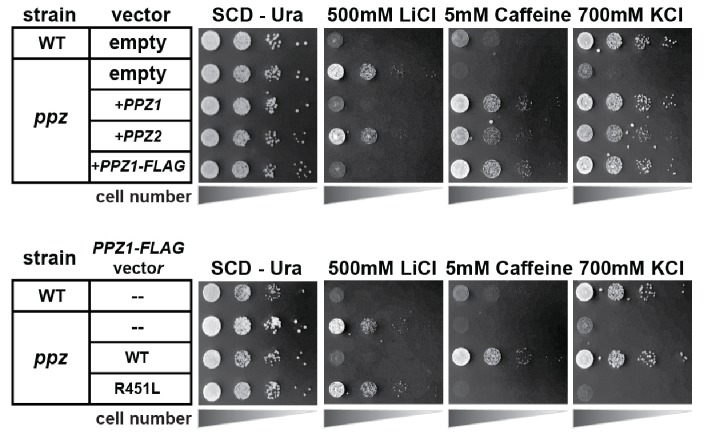
Figure 1—figure supplement 5. Catalytic activity of the Ppz1 phosphatase is required for phenotype complementation.

Figure 1—figure supplement 5.

In this experiment, yeast cells (SEY6210 background) containing either empty vector of the indicated complementation vector were plated in 10-fold serial dilutions on indicated plates.