. 2017 Nov 13;6:e29176. doi: 10.7554/eLife.29176

Figure 3. The Ser57 position of ubiquitin is a critical determinant of ubiquitin metabolism.

(A) SDS-PAGE immunoblot analysis of lysates from cells expressing FLAG-tagged ubiquitin from the GAL10 galactose-inducible promoter. Yeast strains were grown to mid-log phase in glucose media, induced to express FLAG-ubiquitin by shifting to galactose-containing media overnight, and then shifted back to glucose-containing media to repress further transcription of FLAG-ubiquitin. The top panel shows α–FLAG immunoblots and the bottom panel shows immunoblots of G6PDH, a loading control. Mono-ubiquitin is indicated by the red arrow. (B and C) Quantitation of ubiquitin degradation for wildtype, S57D (B) and S57A (C) ubiquitin was averaged (n = 4) with error bars indicating standard deviation. (D) Ubiquitin half-life was estimated based on trendline regression analysis. (E) Overlay of 15N-1H HSQC spectra generated for wild-type ubiquitin (black) and Ser57Asp phosphomimetic ubiquitin (red). Residues that are significantly perturbed in the phosphomimetic are labeled. (F) Residues perturbed in the Ser57Asp phosphomimetic (from Figure 3E) were mapped onto the structure of ubiquitin (PDB entry 1UBQ) in red. Key phosphorylation sites at Ser57 and Ser65 (cyan) are labeled.

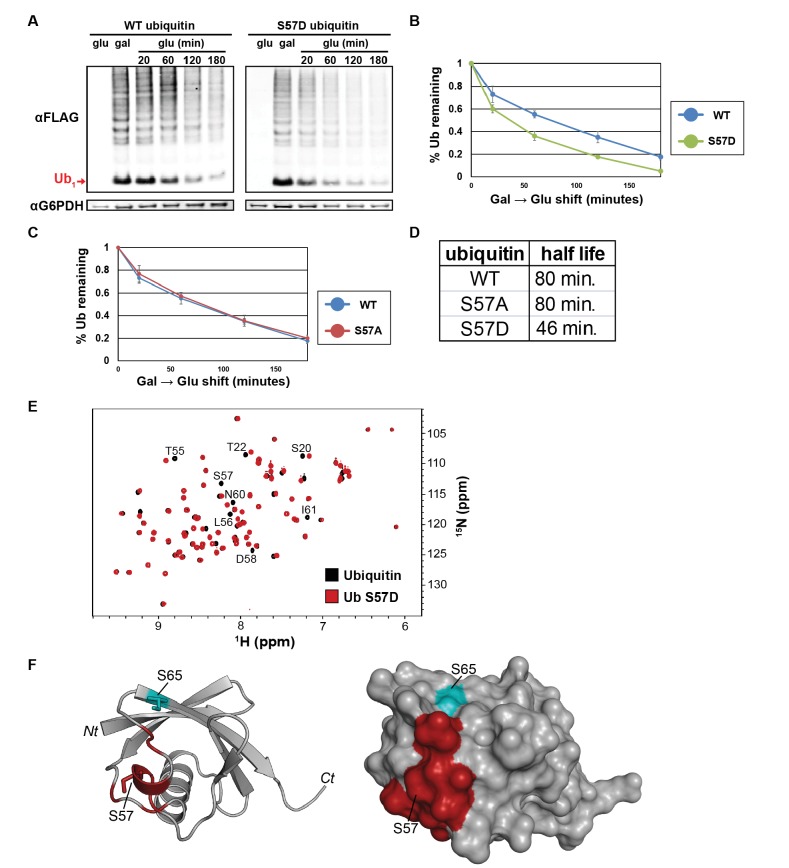
Figure 3.

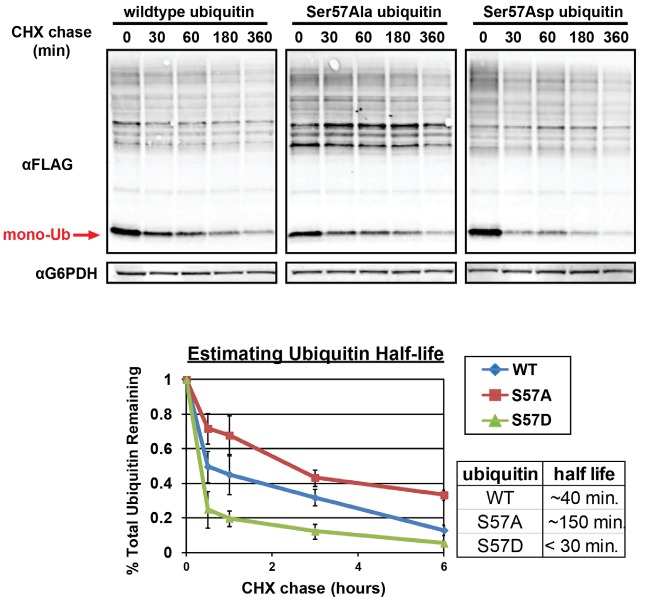
Figure 3—figure supplement 1. Analysis of ubiquitin half-life by SDS-PAGE immunoblot analysis of yeast lysates following a cycloheximide (CHX) chase (top panel).

Figure 3—figure supplement 1.

Yeast strains used in these experiments express FLAG-tagged ubiquitin from the endogenous RPS31 locus. Quantitation of ubiquitin degradation (bottom panel) was averaged (n = 3) and error bars indicated standard deviation. Half-life was estimated in each case using trendline regression (table, inset bottom right).
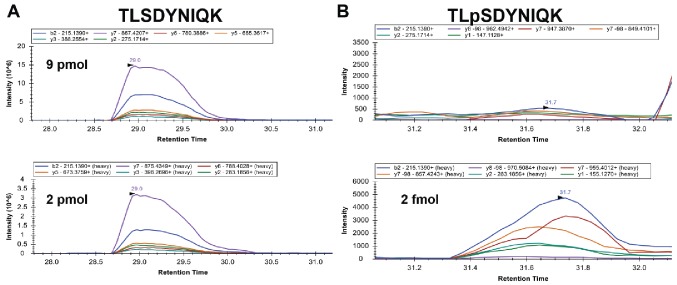
Figure 3—figure supplement 2. Analysis of stoichiometry of Ser57 phosphorylation of ubiquitin.

Figure 3—figure supplement 2.

Isotopically labeled (heavy) standard peptides corresponding to unmodified (bottom left) or Ser57 phosphorylated (bottom right) ubiquitin were spiked into ubiquitin affinity purified from ppz mutant yeast cells and multiple reaction monitoring analysis was performed. The top panels show the corresponding signal from the biological samples. Inset legends indicate plots for specific transitions. Based on transition peak areas, we calculate 9 pmol of the unmodified peptide in the biological sample. The phosphopeptide in the biological sample is below our limit of quantification but occurs at significantly less than 2 fmol.