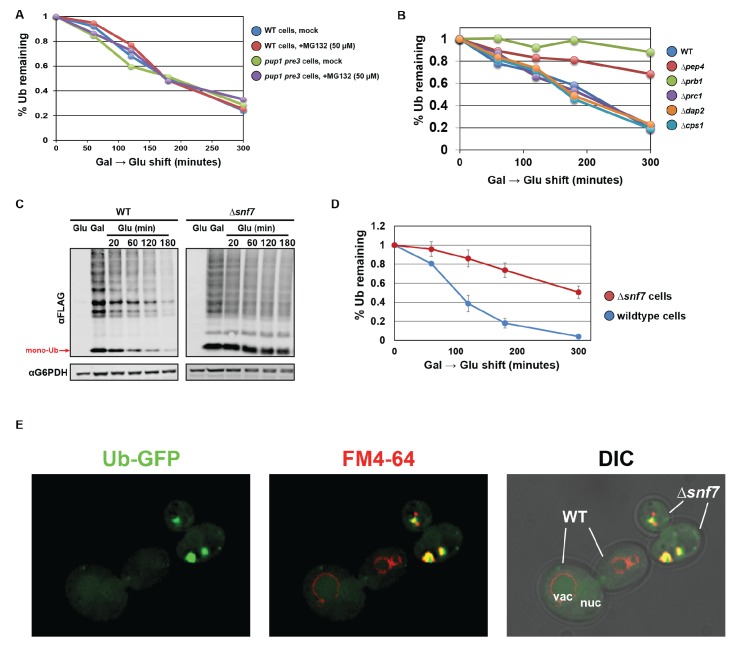
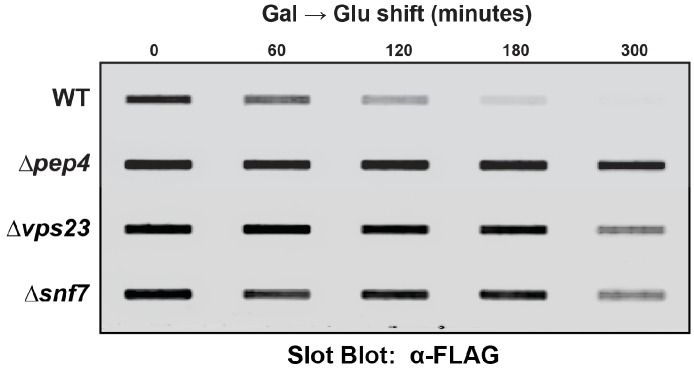
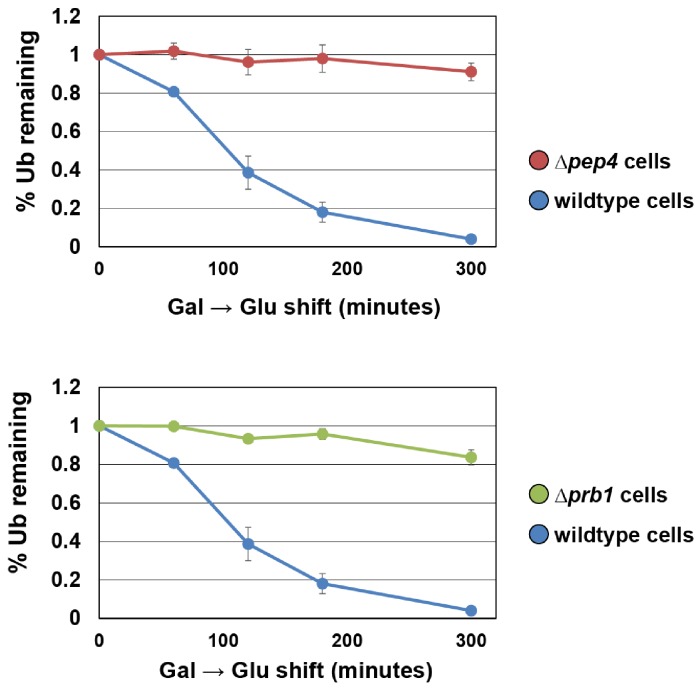
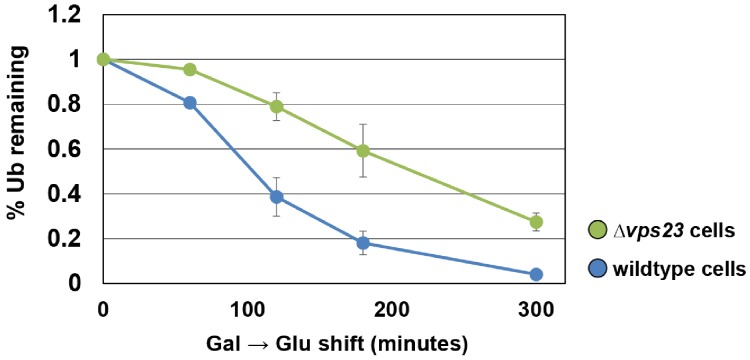
Figure 7. Ubiquitin is degraded in the vacuole via the ESCRT pathway.
(A) Analysis of ubiquitin half-life following galactose induction/glucose repression in wild-type or pup1pre3 mutant yeast cells (strain background WCG4A) that have been mock-treated or treated with 50 µM MG-132, a proteasome inhibitor. (B) Analysis of ubiquitin half-life following galactose induction/glucose repression in wild-type or vacuole protease mutant yeast cells (strain background BY4742). (C) SDS-PAGE and immunoblot analysis of lysates collected from yeast cells following a galactose induction/glucose repression experiment to measure ubiquitin half-life. (D) Quantitation of slot blot analysis of FLAG-ubiquitin levels following a galactose induction/glucose repression (n = 4). Error bars indicate standard deviation. (E) Fluorescence microscopy imaging of GFP-tagged ubiquitin (green) in cells where FM4-64 (red) has been chased to label the vacuole membrane. Wild-type and Δsnf7 cells were mixed prior to imaging, with the field showing both wild-type cells and Δsnf7 cells, which are distinguished by the presence of an E-compartment.


