FIGURE 5:
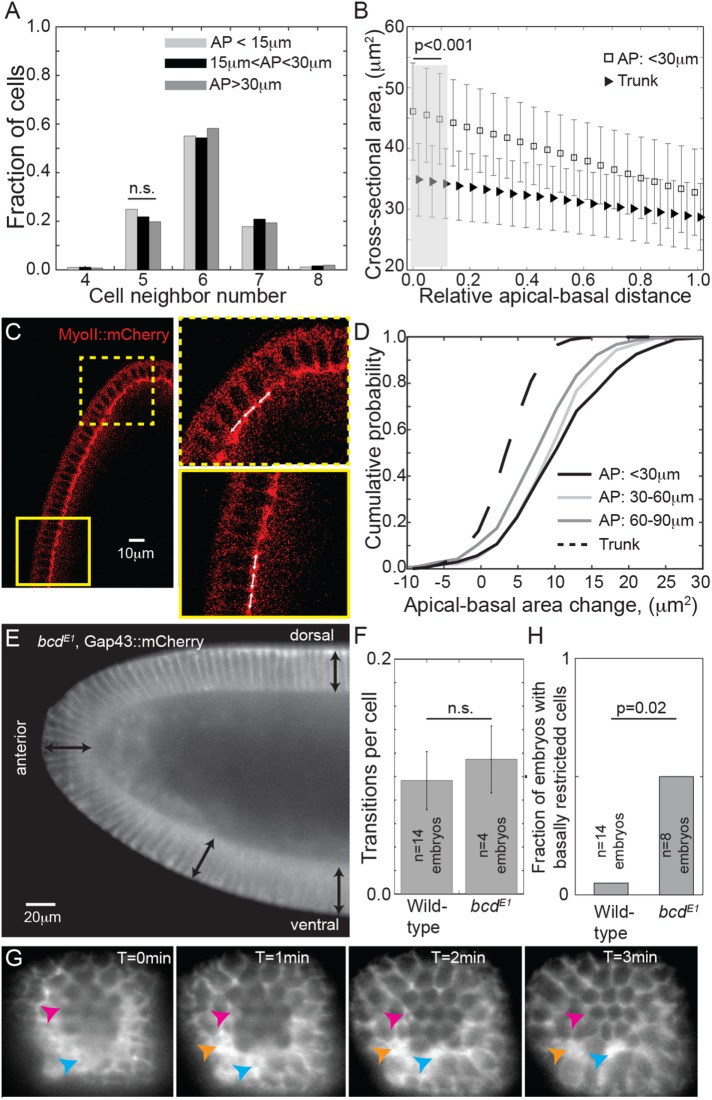
Cell packing and shape in the anterior pole. (A) Cell neighbor number distribution for cells at different distances from the anterior pole. n = 10 embryos, >1000 cells. No significant change in packing density is observed. (B) The cross-sectional surface area of the cells from apical to basal surfaces in the trunk (triangles) and within 30 μm of the anterior pole (squares). n = 10 embryos, >1000 cells. Error bars = SD. The apical surface area is significantly larger in the anterior pole compared with the trunk (gray region). (C) Embryo expressing Sqh::mCherry in the anterior pole during cellularization. Yellow boxes denote zoomed regions. The white arrows are the same length. (D) Cumulative probability distribution for the change in area from apical to basal surface for cells at different positions relative to the anterior pole. n = 10 embryos, >1000 cells. The area change in the anterior is significantly different from the trunk (p < 10–3, using a Kolmogorov-Smirnov test). (E) Lateral view of bcdE1 embryo expressing Gap43::mCherry, imaged on a light-sheet microscope. Black arrows are equal length. (F) The frequency of pseudo-T1 transitions is similar in wild-type and bcdE1 embryos in the anterior. Error bars = SEM. (G) Anterior–posterior axis view of bcdE1 embryo expressing Gap43::mCherry, imaged on a light-sheet microscope. Arrows denote cells with significantly reduced basal surface compared with their neighbors. (H) Comparison of fraction of wild-type and bcdE1 embryos with cells that have significantly reduced basal surface in the anterior region. p-value calculated using two-proportion z-test.

