FIGURE 7:
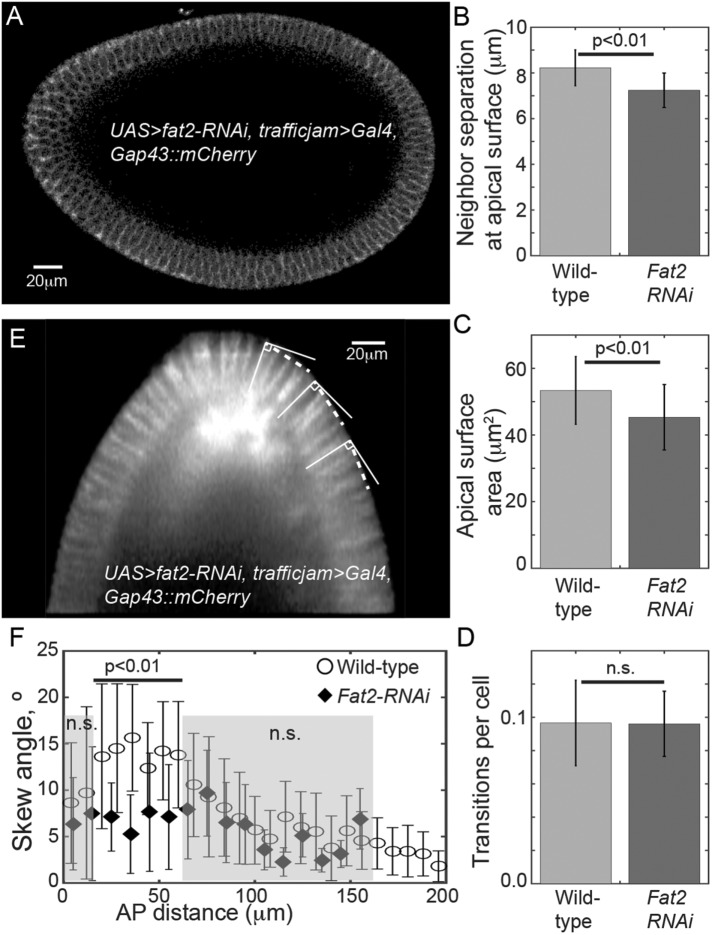
Distorting embryo geometry can alter cell arrangement. (A) Embryo expressing Gap43::mCherry with UAS>fat2-RNAi, trafficjam>Gal4. Embryo oriented anterior to left and dorsal at top. Note that the dorsal side is more curved than in wild-type embryos. (B) fat2-RNAi embryos show reduced neighbor separation and (C) reduced apical surface area (n = 6 for fat2-RNAi embryos and n = 5 for wild-type embryos, with >250 cells in total for each genotype). Error bars are SD. (D) There is not a significant change in the frequency of pseudo-T1 transitions (n = 6 for fat2-RNAi embryos), error bars SEM. (E) Skew in fat2-RNAi embryos is reduced. The dashed line shows the direction parallel to the surface at each point. The same angle is used for all three cells highlighted. (F) Skew against distance from anterior pole for wild-type and fat2-RNAi embryos. Skew is reduced in fat2-RNAi embryos compared with wild type within the proximal tip (p < 0.01). Error bars are SD.

