FIGURE 8:
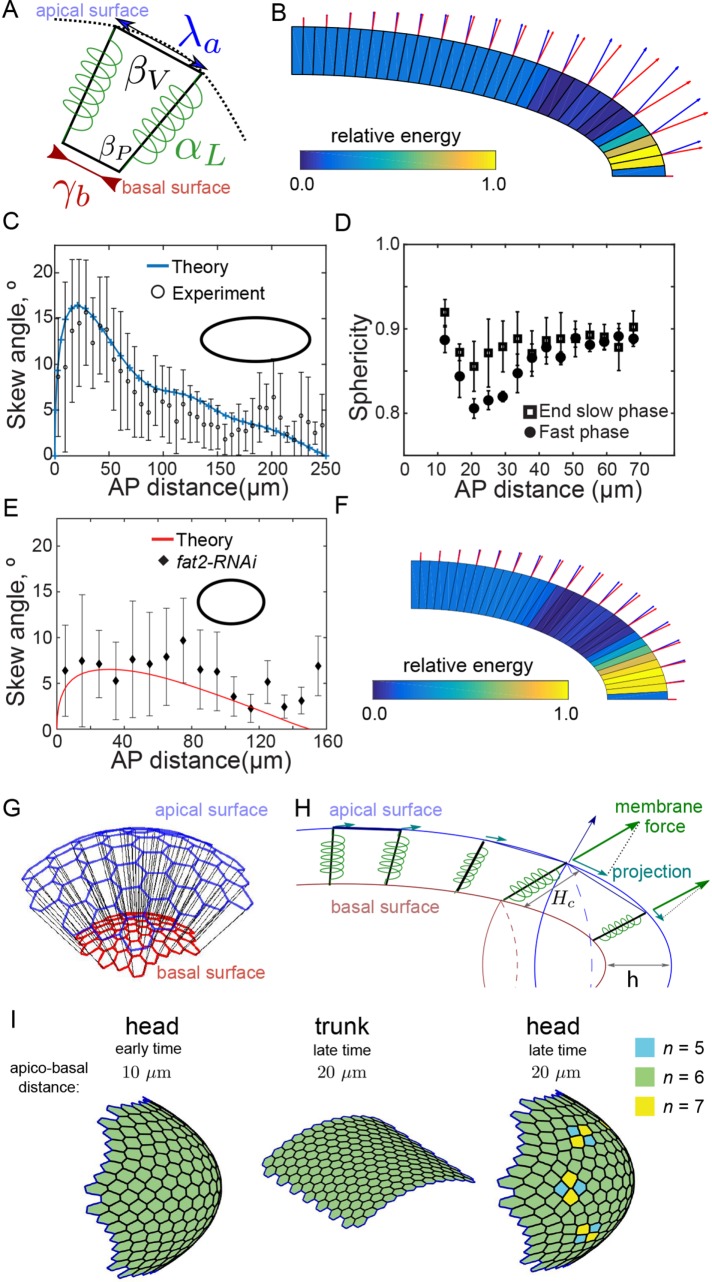
Vertex model incorporating geometric constraints is consistent with both observed cellular skew and cellular rearrangements. (A) Parameters of the vertex model: αL, γb, λa control tension along the lateral, basal, and apical edges, respectively; βV and βP represent regulations of cell volume and membrane area. Vertices on the apical side are constrained to move along an ellipse (dashed line) that models the interaction with the fixed vitelline membrane (see also Supplemental Figure S8). (B) Output from vertex model simulation. The skew is defined as the angle between the normal to the apical surface (blue arrow) and the cellular edge (red arrow, the size of arrows is proportional to the value of the tilt angle). Cells are colored according to their energy level (in units of the maximal energy level). (C) Cellular skew, as measured in experiments (black circles, error bars = SD) and simulations (blue). Ellipse represents geometry simulated, where the long axis is 2.5 times longer than the short axis. (D) The nucleus sphericity (1 = perfect sphere, 0 = line) as a function of distance from the anterior pole at the end of slow phase (squares, n = 4 embryos, >600 nuclei) and during fast phase (circles, n = 4 embryos, >600 nuclei). Error bars = SD. (E) Comparison of model prediction for skew in fat2-RNAi embryos with experimentally measured skew. Parameters same as for C except the geometry simulated, where the long axis is 1.5 times longer than the short axis. (F) As in B but with reduced embryo length, as in fat2-RNAi embryos. (G) Schematic of vertex model used to explore role of geometry on cell arrangements in three dimensions. (H) Resulting force on tricellular junctions due to cell growth and confinement. The apical (blue) and basal (red) surfaces are connected by lateral cell walls, modeled as springs (black junctions connecting apical and basal vertices). (I) Cell packing on the apical surface. Color coding represents neighbor number of each cell. At initiation (left), all cells are hexagonal. At later times, after 10 μm of effective cell invagination, T1 transitions are only observed on ellipsoidal surfaces (right) and not cylindrical surfaces (center).

