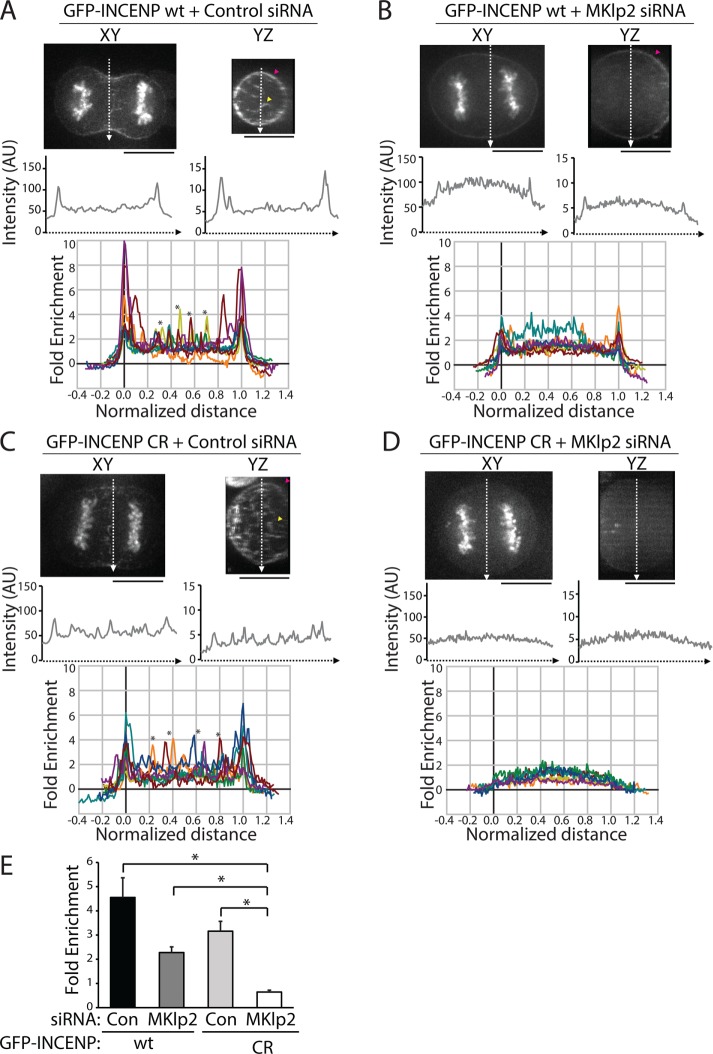
FIGURE 3:
Cortical enrichment of GFP-INCENP at the division plane requires MKlp2 and INCENP-actin binding. (A) Top, single z-plane micrographs in the XY and YZ dimensions of the division plane in a HeLa cell expressing GFP-INCENP treated with control siRNA. Pink arrowhead denotes cortical GFP-INCENP fluorescence; yellow arrowhead marks GFP-INCENP fluorescence on a midzone bundle. Scale bars, 10 μm. Middle, line scans across XY or YZ projections of the division plane in the cell shown above. Bottom, fold enrichment of GFP-INCENP fluorescence intensity, relative to cytoplasmic fluorescence, from line scans across the YZ projection of cells treated with control siRNA. Asterisks mark peaks of GFP-INCENP localized to midzone bundles. n = 10 cells. (B) Top, single z-plane micrographs in the XY and YZ dimensions of the division plane in a cell expressing GFP-INCENP treated with MKlp2 siRNA. Pink arrowhead denotes cortical GFP-INCENP fluorescence. Scale bars, 10 μm. Middle, line scans across XY or YZ projections of the division plane in the cell shown above. Bottom, fold enrichment of GFP-INCENP fluorescence intensity, relative to cytoplasmic fluorescence, from line scans across the YZ projection of cells treated with MKlp2 siRNA. (C) Top, single z-plane micrographs in the XY and YZ dimensions of the division plane in a HeLa cell expressing GFP-INCENP CR treated with control siRNA. Pink arrowhead denotes cortical GFP-INCENP CR fluorescence; yellow arrowhead marks GFP-INCENP CR fluorescence on a midzone bundle. Scale bars, 10 μm. Middle, line scans across XY or YZ projections of the division plane in the cell shown above. Bottom, fold enrichment of GFP-INCENP CR fluorescence intensity, relative to cytoplasmic fluorescence, from line scans across the YZ projection of cells treated with control siRNA. Asterisks mark peaks of GFP-INCENP CR localized to midzone bundles. n = 10 cells. (D) Top, single z-plane micrographs in the XY and YZ dimensions of the division plane in a HeLa cell expressing GFP-INCENP CR treated with MKlp2 siRNA. Scale bars, 10 μm. Middle, line scans across XY or YZ projections of the division plane in the cell shown above. Bottom, fold enrichment of GFP-INCENP CR fluorescence intensity, relative to cytoplasmic fluorescence, from line scans across the YZ projection of cells treated with MKlp2 siRNA. n = 9 cells. (E) Quantification of cortical peak intensities of GFP-INCENP or GFP-INCENP CR from line scans across the YZ projection as described in A–D. Three adjacent peak intensity values were averaged for each individual cell. n ≥ 9 cells,*p < 0.05.

