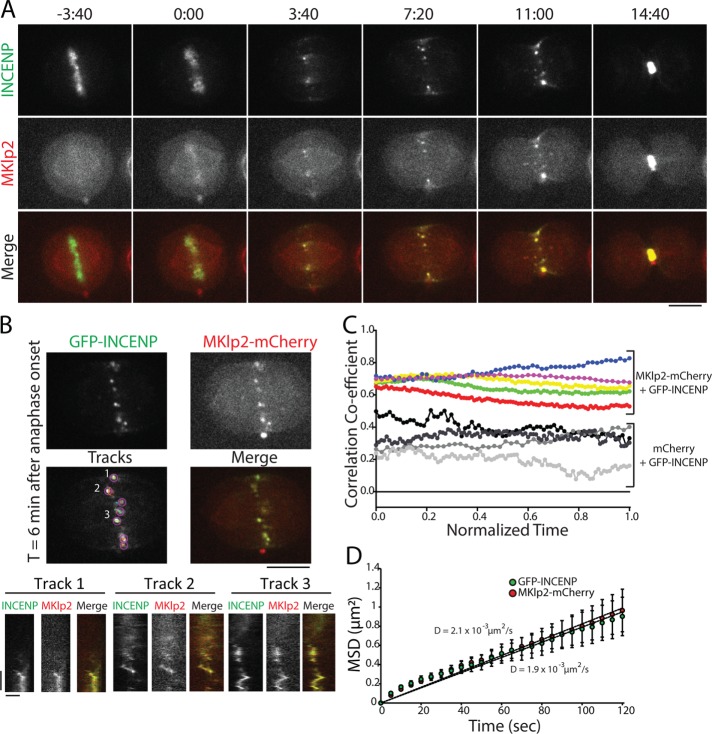
FIGURE 5:
GFP-INCENP and MKlp2-mCherry are colocalized on the midzone throughout mitotic exit. (A) Single z-plane micrographs of the midzone taken from a time-lapse movie of a HeLa cell transiently expressing GFP-INCENP and MKlp2-mCherry plated on 100 µg/ml fibronectin. Time is indicated in minutes:seconds relative to anaphase onset (0:00). Scale bar, 10 μm. (B) Top, single z-plane micrograph taken from the time-lapse movie shown in A representing a time point 6 min after anaphase onset. The “tracks” panel highlights examples of spots and tracks used to quantify MSD. Numbers indicate tracks that correspond to kymographs below. Scale bar, 10 μm. Bottom, kymographs of GFP-INCENP and MKlp2-mCherry fluorescence generated from the spots indicated above. Scale bars, 100 s (y-axis) and 1 μm (x-axis). (C) Pearson’s r of GFP-INCENP and MKlp2-mCherry on the midzone (colored circles). Colocalization was quantified from immediately after anaphase onset (t = 0) to immediately before cleavage furrow ingression (t = 1). Control cells expressing GFP-INCENP and mCherry are represented by grayscale circles. n = 3 cells (control) and 5 cells (experimental) from three independent experiments. (D) MSD of GFP-INCENP (green circles) and MKlp2-mCherry (red circles) spots in the cortical plane and in the midzone during anaphase. Data represent mean ± SE. Linear regression represents best fit used to calculate the diffusion coefficient. Diffusion coefficient = 1.9 × 10⁻³ µm2/s (GFP-INCENP) or 2.1 × 10⁻³ µm2/s (MKlp2-mCherry). n = 626 tracks (GFP-INCENP) or 424 tracks (MKlp2-mCherry) from six cells from three independent experiments.

