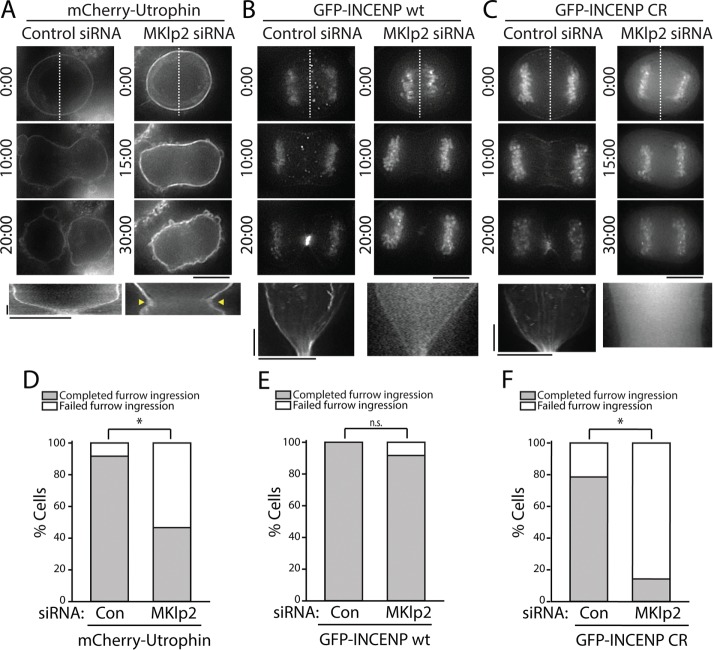
FIGURE 7:
Overexpression of GFP-INCENP rescues cleavage furrow ingression in MKlp2-depleted cells. (A) Top, single z-plane micrographs taken from time-lapse movies of cells transiently expressing mCherry-Utrophin after treatment with a control or MKlp2-targeting siRNA. Time is indicated in minutes:seconds. Dashed lines were used to generate kymographs. Scale bar, 10 μm. Bottom, kymographs of mCherry-Utrophin fluorescence across the division plane. Yellow arrows represent cleavage furrow regression. Scale bars, 2.5 min (y-axis) and 10 μm (x-axis). (B) Top, single z-plane micrographs taken from time-lapse movies of cells transiently expressing GFP-INCENP after treatment with a control or MKlp2-targeting siRNA. Time is indicated in minutes:seconds. Dashed lines were used to generate kymographs. Scale bar, 10 μm. Bottom, kymographs of GFP-INCENP fluorescence across the division plane. Scale bars, 2.5 min (y-axis) and 10 μm (x-axis). (C) Top, single z-plane micrographs taken from time-lapse movies of cells transiently expressing GFP-INCENP CR after treatment with a control or MKlp2-targeting siRNA. Time is indicated in minutes:seconds. Dashed lines were used to generate kymographs. Scale bar, 10 μm. Bottom, kymographs of GFP-INCENP CR fluorescence across the division plane. Scale bars, 2.5 min (y-axis) and 10 μm (x-axis). (D) Quantification of the percentage of cells from A that successfully completed furrow ingression. n = 12 (control) and 15 (MKlp2 siRNA) cells, *p < 0.05. (E) Quantification of total percentage of cells from B that successfully completed furrow ingression. n = 14 cells for each condition, n = 8 (control) and 12 (MKlp2 siRNA) cells. (F) Quantification of total percentage of cells from C that successfully completed furrow ingression. n = 14 cells for each condition, *p < 0.05.

